

Corak sebenar

Bullish Symmetrical Triangle
was formed on 18.04 at 21:02:57 (UTC+0)
signal strength 2 of 5

According to the chart of M15, EURJPY formed the Bullish Symmetrical Triangle pattern, which signals the trend will continue. Description. The upper border of the pattern touches the coordinates 162.14/161.96 whereas the lower border goes across 161.84/161.96. The pattern width is measured on the chart at 30 pips. If the Bullish Symmetrical Triangle pattern is in progress during the upward trend, this indicates the current trend will go on. In case 161.96 is broken, the price could continue its move toward 162.18.
The M5 and M15 time frames may have more false entry points.
Juga lihat
- All
- All
- Bearish Rectangle
- Bearish Symmetrical Triangle
- Bearish Symmetrical Triangle
- Bullish Rectangle
- Double Top
- Double Top
- Triple Bottom
- Triple Bottom
- Triple Top
- Triple Top
- All
- All
- Buy
- Sale
- All
- 1
- 2
- 3
- 4
- 5
Double Bottom
was formed on 30.04 at 21:30:36 (UTC+0)
signal strength 1 of 5
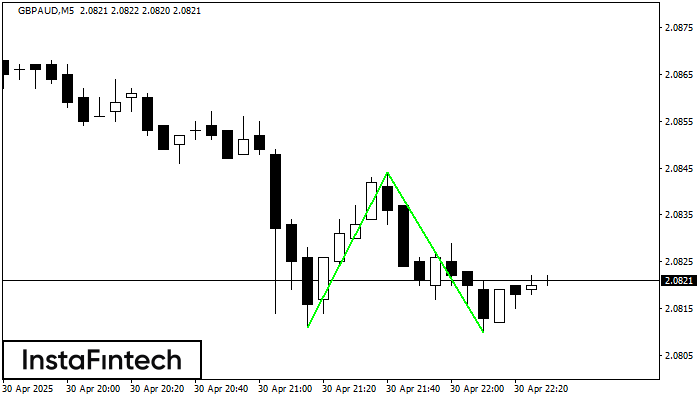
Corak Double Bottom telah dibentuk pada GBPAUD M5; sempadan atas adalah 2.0844; sempadan bawah adalah 2.0810. Lebar corak adalah 33 mata. Sekiranya penembusan sempadan atas 2.0844, perubahan aliran boleh diramalkan
Carta masa M5 dan M15 mungkin mempunyai lebih banyak titik kemasukan palsu.
Open chart in a new window
Segi Empat Menaik
was formed on 30.04 at 21:12:49 (UTC+0)
signal strength 4 of 5

Berdasarkan carta H1, #TSLA telah membentuk Segi Empat Menaik. Jenis corak ini menunjukkan kesinambungan aliran. Ia terdiri daripada dua tahap: rintangan 294.59 dan sokongan 270.55. Sekiranya tahap rintangan 294.59
Open chart in a new window
Segi Empat Menaik
was formed on 30.04 at 21:12:27 (UTC+0)
signal strength 4 of 5
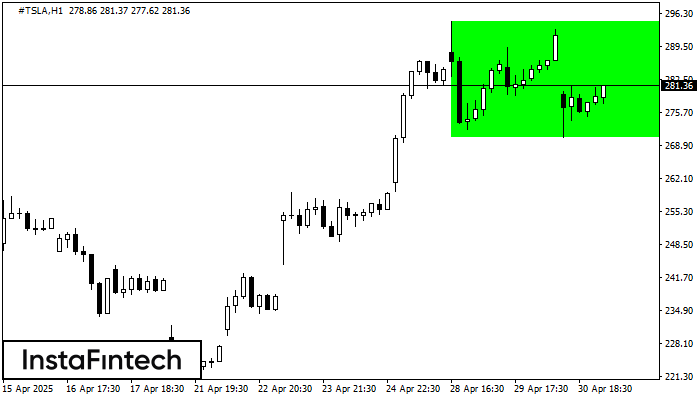
Berdasarkan carta H1, #TSLA telah membentuk Segi Empat Menaik. Corak ini menunjukkan kesinambungan aliran. Sempadan atas adalah 294.59, sempadan bawah adalah 270.55. Isyarat bermakna bahawa kedudukan panjang perlu dibuka
Open chart in a new window


