

Corak sebenar

Triple Top
was formed on 18.04 at 18:00:33 (UTC+0)
signal strength 3 of 5
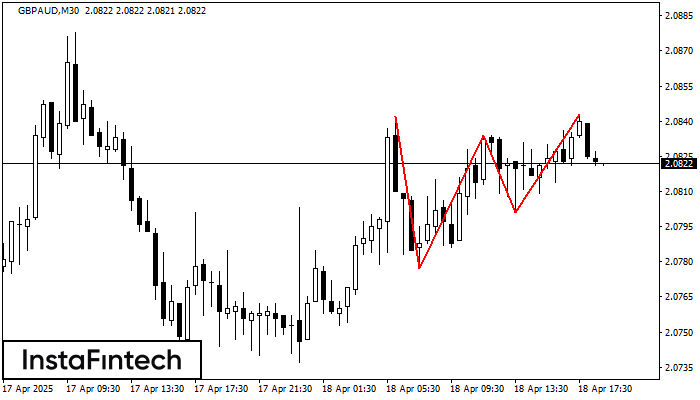
The Triple Top pattern has formed on the chart of the GBPAUD M30. Features of the pattern: borders have an ascending angle; the lower line of the pattern has the coordinates 2.0777/2.0801 with the upper limit 2.0842/2.0843; the projection of the width is 65 points. The formation of the Triple Top figure most likely indicates a change in the trend from upward to downward. This means that in the event of a breakdown of the support level of 2.0777, the price is most likely to continue the downward movement.
Juga lihat
- All
- All
- Bearish Rectangle
- Bearish Symmetrical Triangle
- Bearish Symmetrical Triangle
- Bullish Rectangle
- Double Top
- Double Top
- Triple Bottom
- Triple Bottom
- Triple Top
- Triple Top
- All
- All
- Buy
- Sale
- All
- 1
- 2
- 3
- 4
- 5
Double Top
was formed on 02.06 at 17:30:00 (UTC+0)
signal strength 1 of 5
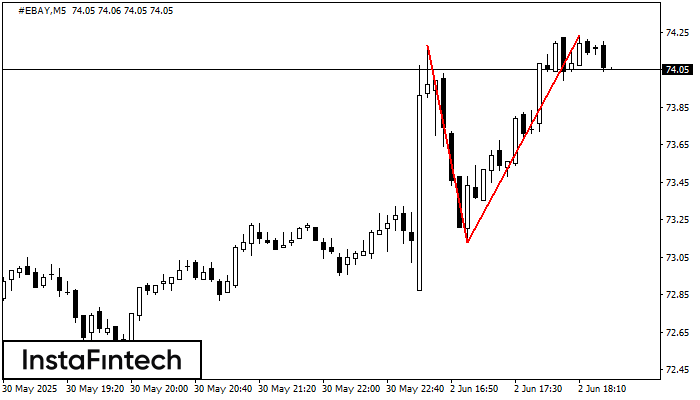
Pada carta #EBAY M5 corak pembalikan Double Top telah terbentuk. Ciri-ciri: sempadan atas 74.23; sempadan bawah 73.13; lebar corak 110 mata. Isyarat: penembusan sempadan bawah akan menyebabkan kesinambungan arah aliran
Carta masa M5 dan M15 mungkin mempunyai lebih banyak titik kemasukan palsu.
Open chart in a new window
Pennant Aliran Menurun
was formed on 02.06 at 17:29:49 (UTC+0)
signal strength 2 of 5
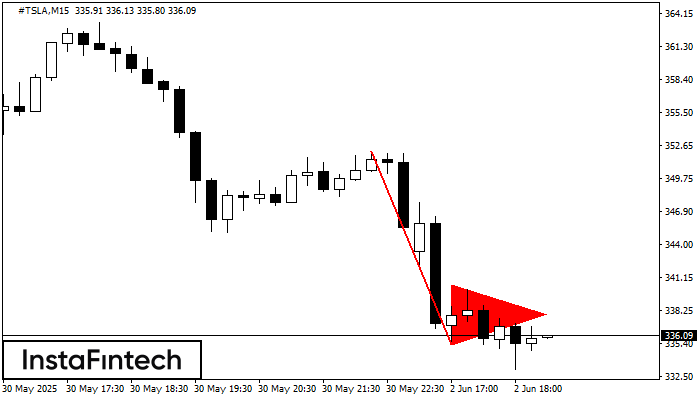
Corak Pennant Aliran Menurun telah dibentuk pada carta #TSLA M15. Jenis corak ini dicirikan oleh sedikit penurunan di mana selepas itu harga akan bergerak ke arah aliran asal. Sekiranya harga
Carta masa M5 dan M15 mungkin mempunyai lebih banyak titik kemasukan palsu.
Open chart in a new window
Triple Top
was formed on 02.06 at 17:29:48 (UTC+0)
signal strength 1 of 5
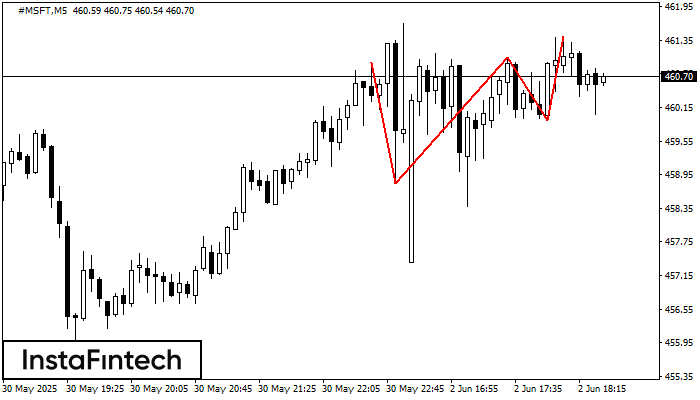
Pada carta instrumen dagangan #MSFT M5, corak Triple Top yang menandakan perubahan aliran telah terbentuk. Adalah mungkin bahawa selepas pembentukan bahagian atas ketiga, harga akan cuba menembusi tahap rintangan 458.79
Carta masa M5 dan M15 mungkin mempunyai lebih banyak titik kemasukan palsu.
Open chart in a new window


