

Corak sebenar

Bearish Flag
was formed on 17.04 at 18:36:16 (UTC+0)
signal strength 5 of 5
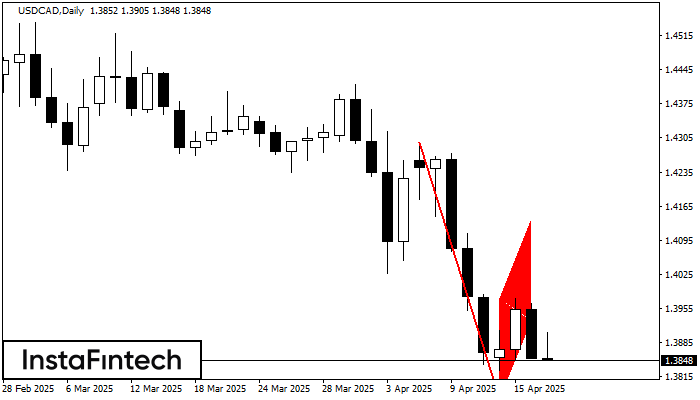
The Bearish Flag pattern has been formed on the chart USDCAD D1 which signals that the downward trend will continue. If the price breaks below the low at 1.3767, then it is most likely to move further downwards. The price will likely move by the number of points which equals the length of the flag pole (20 points).
- All
- All
- Bearish Rectangle
- Bearish Symmetrical Triangle
- Bearish Symmetrical Triangle
- Bullish Rectangle
- Double Top
- Double Top
- Triple Bottom
- Triple Bottom
- Triple Top
- Triple Top
- All
- All
- Buy
- Sale
- All
- 1
- 2
- 3
- 4
- 5
Triple Top
was formed on 01.05 at 15:45:01 (UTC+0)
signal strength 2 of 5
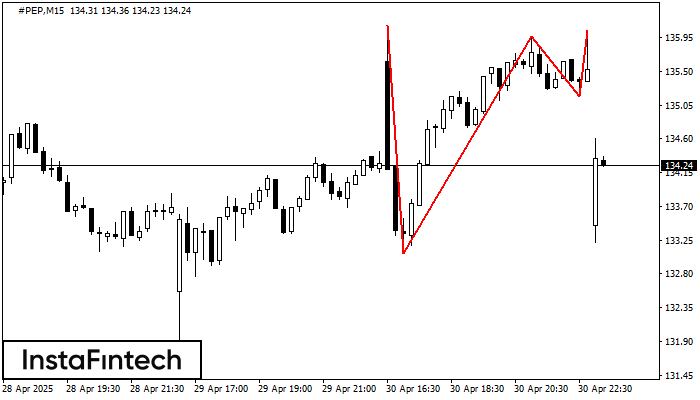
The Triple Top pattern has formed on the chart of the #PEP M15 trading instrument. It is a reversal pattern featuring the following characteristics: resistance level 6, support level -210
The M5 and M15 time frames may have more false entry points.
Open chart in a new window
Triple Top
was formed on 01.05 at 15:44:50 (UTC+0)
signal strength 2 of 5
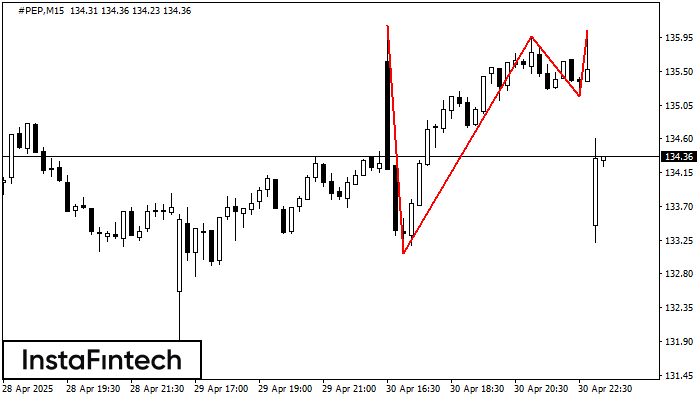
On the chart of the #PEP M15 trading instrument, the Triple Top pattern that signals a trend change has formed. It is possible that after formation of the third peak
The M5 and M15 time frames may have more false entry points.
Open chart in a new window
Double Top
was formed on 01.05 at 15:20:12 (UTC+0)
signal strength 1 of 5
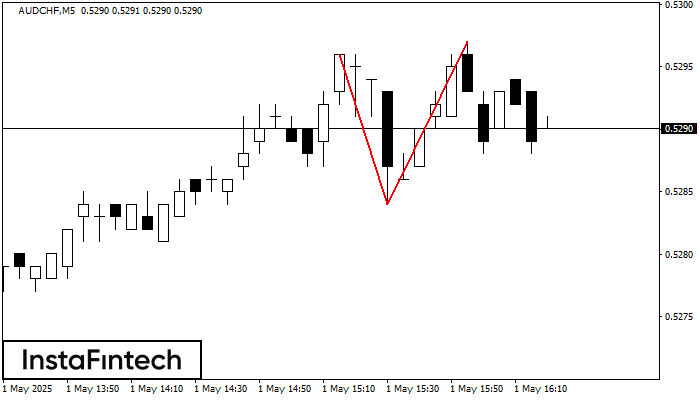
The Double Top pattern has been formed on AUDCHF M5. It signals that the trend has been changed from upwards to downwards. Probably, if the base of the pattern 0.5284
The M5 and M15 time frames may have more false entry points.
Open chart in a new window

