

Corak sebenar

Bearish Symmetrical Triangle
was formed on 17.04 at 13:58:48 (UTC+0)
signal strength 1 of 5

According to the chart of M5, GBPUSD formed the Bearish Symmetrical Triangle pattern. Trading recommendations: A breach of the lower border 1.3203 is likely to encourage a continuation of the downward trend.
The M5 and M15 time frames may have more false entry points.
- All
- All
- Bearish Rectangle
- Bearish Symmetrical Triangle
- Bearish Symmetrical Triangle
- Bullish Rectangle
- Double Top
- Double Top
- Triple Bottom
- Triple Bottom
- Triple Top
- Triple Top
- All
- All
- Buy
- Sale
- All
- 1
- 2
- 3
- 4
- 5
Bearish Rectangle
was formed on 04.06 at 21:14:46 (UTC+0)
signal strength 1 of 5
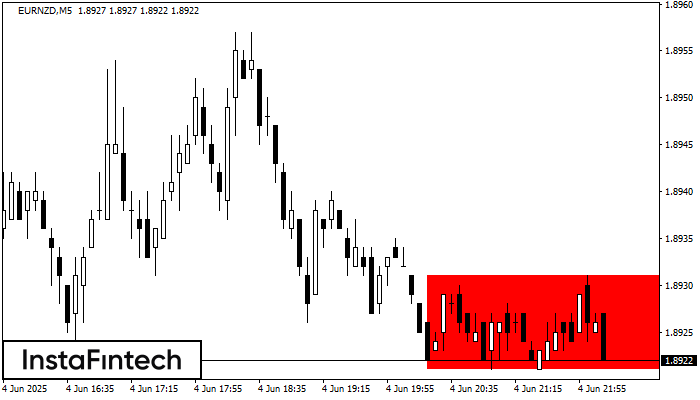
According to the chart of M5, EURNZD formed the Bearish Rectangle which is a pattern of a trend continuation. The pattern is contained within the following borders: lower border 1.8921
The M5 and M15 time frames may have more false entry points.
Open chart in a new window
Double Top
was formed on 04.06 at 21:01:03 (UTC+0)
signal strength 2 of 5
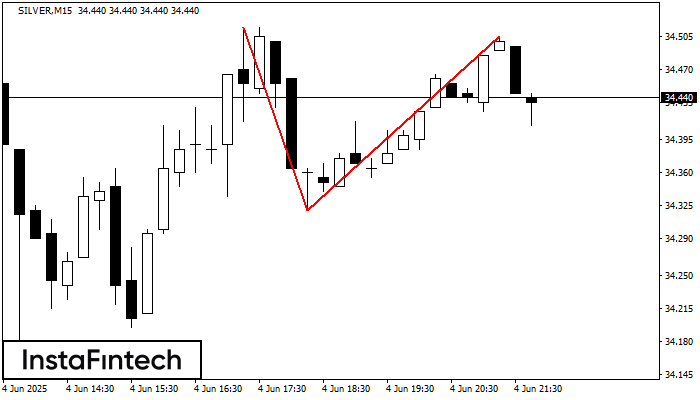
The Double Top pattern has been formed on SILVER M15. It signals that the trend has been changed from upwards to downwards. Probably, if the base of the pattern 34.32
The M5 and M15 time frames may have more false entry points.
Open chart in a new window
Bearish Symmetrical Triangle
was formed on 04.06 at 20:38:48 (UTC+0)
signal strength 1 of 5
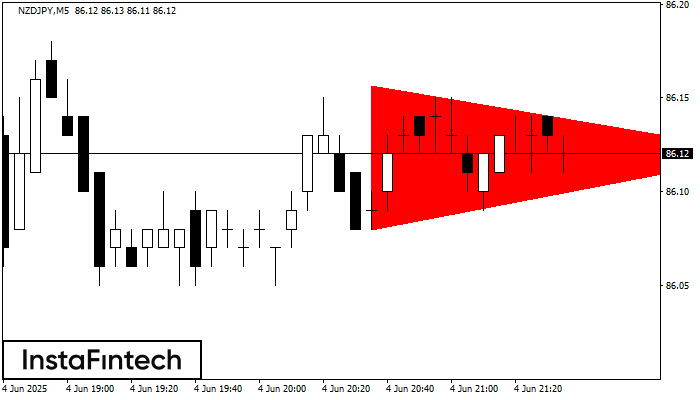
According to the chart of M5, NZDJPY formed the Bearish Symmetrical Triangle pattern. This pattern signals a further downward trend in case the lower border 86.08 is breached. Here
The M5 and M15 time frames may have more false entry points.
Open chart in a new window


