

Corak sebenar

Bearish Symmetrical Triangle
was formed on 17.04 at 13:57:41 (UTC+0)
signal strength 3 of 5

According to the chart of M30, EURUSD formed the Bearish Symmetrical Triangle pattern. This pattern signals a further downward trend in case the lower border 1.1264 is breached. Here, a hypothetical profit will equal the width of the available pattern that is -195 pips.
Juga lihat
- All
- All
- Bearish Rectangle
- Bearish Symmetrical Triangle
- Bearish Symmetrical Triangle
- Bullish Rectangle
- Double Top
- Double Top
- Triple Bottom
- Triple Bottom
- Triple Top
- Triple Top
- All
- All
- Buy
- Sale
- All
- 1
- 2
- 3
- 4
- 5
Bullish Symmetrical Triangle
was formed on 10.06 at 01:45:04 (UTC+0)
signal strength 1 of 5
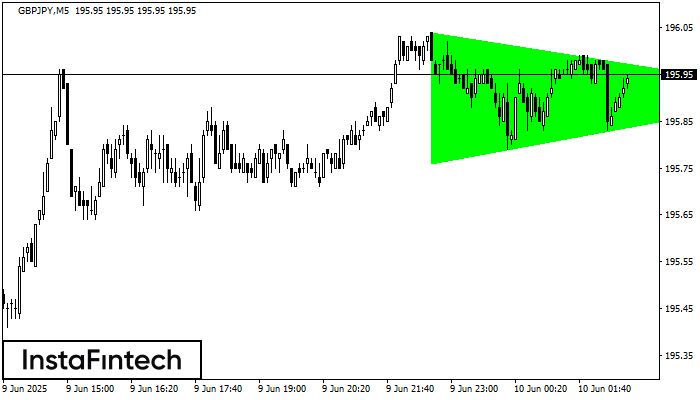
According to the chart of M5, GBPJPY formed the Bullish Symmetrical Triangle pattern. Description: This is the pattern of a trend continuation. 196.04 and 195.76 are the coordinates
The M5 and M15 time frames may have more false entry points.
Open chart in a new window
Bullish Symmetrical Triangle
was formed on 10.06 at 01:36:31 (UTC+0)
signal strength 1 of 5
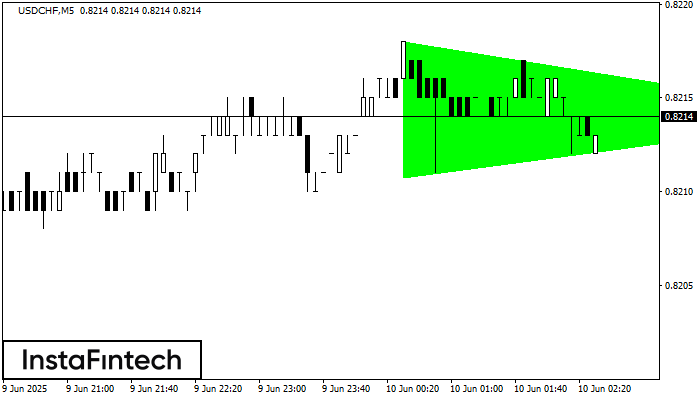
According to the chart of M5, USDCHF formed the Bullish Symmetrical Triangle pattern. The lower border of the pattern touches the coordinates 0.8211/0.8214 whereas the upper border goes across 0.8218/0.8214
The M5 and M15 time frames may have more false entry points.
Open chart in a new window
Double Top
was formed on 10.06 at 01:30:15 (UTC+0)
signal strength 2 of 5
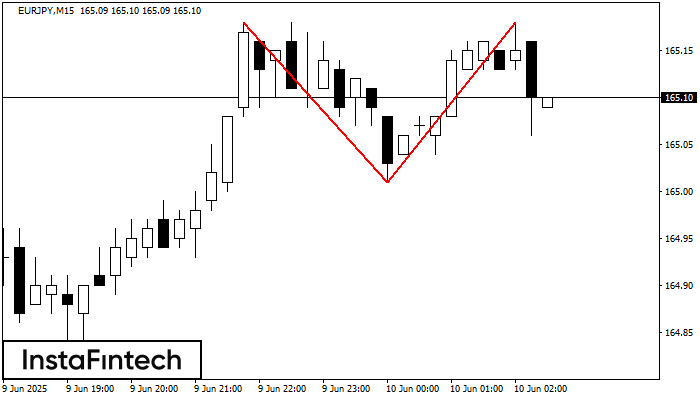
The Double Top reversal pattern has been formed on EURJPY M15. Characteristics: the upper boundary 165.18; the lower boundary 165.01; the width of the pattern is 17 points. Sell trades
The M5 and M15 time frames may have more false entry points.
Open chart in a new window


