

Corak sebenar

Bearish Rectangle
was formed on 17.04 at 11:10:15 (UTC+0)
signal strength 1 of 5

According to the chart of M5, GOLD formed the Bearish Rectangle which is a pattern of a trend continuation. The pattern is contained within the following borders: lower border 3312.24 – 3312.24 and upper border 3324.83 – 3324.83. In case the lower border is broken, the instrument is likely to follow the downward trend.
The M5 and M15 time frames may have more false entry points.
- All
- All
- Bearish Rectangle
- Bearish Symmetrical Triangle
- Bearish Symmetrical Triangle
- Bullish Rectangle
- Double Top
- Double Top
- Triple Bottom
- Triple Bottom
- Triple Top
- Triple Top
- All
- All
- Buy
- Sale
- All
- 1
- 2
- 3
- 4
- 5
Triple Top
was formed on 04.06 at 14:05:39 (UTC+0)
signal strength 1 of 5
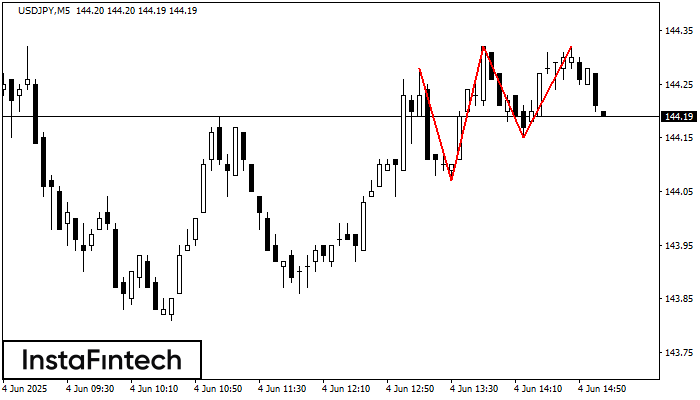
On the chart of the USDJPY M5 trading instrument, the Triple Top pattern that signals a trend change has formed. It is possible that after formation of the third peak
The M5 and M15 time frames may have more false entry points.
Open chart in a new window
Bullish Symmetrical Triangle
was formed on 04.06 at 13:31:06 (UTC+0)
signal strength 1 of 5
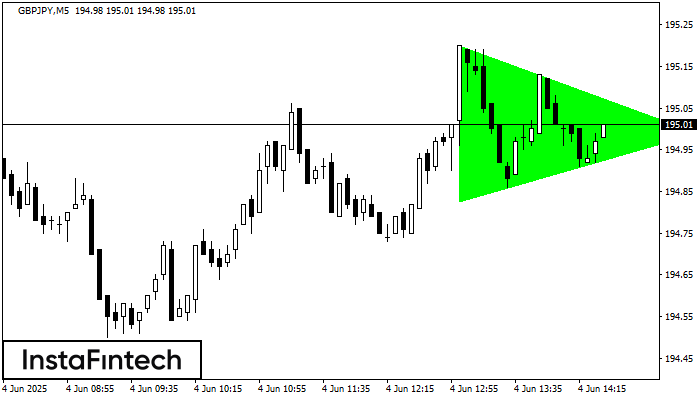
According to the chart of M5, GBPJPY formed the Bullish Symmetrical Triangle pattern, which signals the trend will continue. Description. The upper border of the pattern touches the coordinates 195.20/194.99
The M5 and M15 time frames may have more false entry points.
Open chart in a new window
Bullish Flag
was formed on 04.06 at 12:17:33 (UTC+0)
signal strength 2 of 5
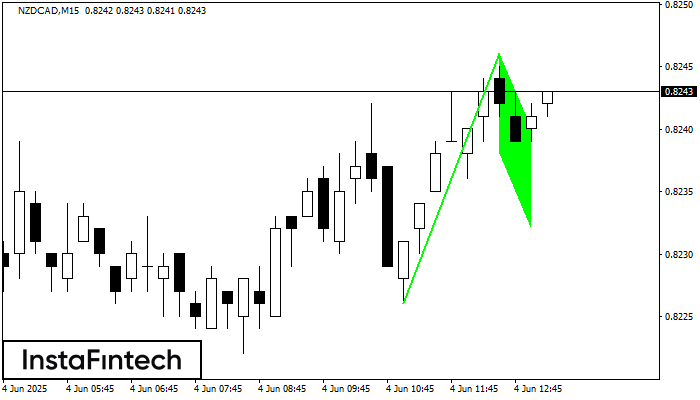
The Bullish Flag pattern has been formed on NZDCAD at M15. The lower boundary of the pattern is located at 0.8238/0.8232, while the higher boundary lies at 0.8246/0.8240. The projection
The M5 and M15 time frames may have more false entry points.
Open chart in a new window


