

Corak sebenar

Double Bottom
was formed on 11.04 at 20:00:26 (UTC+0)
signal strength 4 of 5
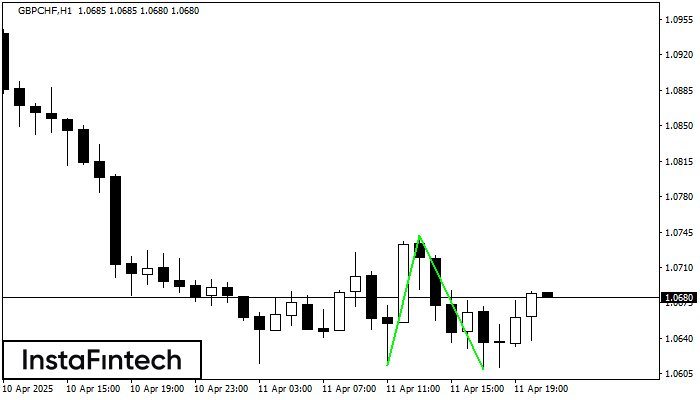
The Double Bottom pattern has been formed on GBPCHF H1. Characteristics: the support level 1.0613; the resistance level 1.0742; the width of the pattern 129 points. If the resistance level is broken, a change in the trend can be predicted with the first target point lying at the distance of 133 points.
- All
- All
- Bearish Rectangle
- Bearish Symmetrical Triangle
- Bearish Symmetrical Triangle
- Bullish Rectangle
- Double Top
- Double Top
- Triple Bottom
- Triple Bottom
- Triple Top
- Triple Top
- All
- All
- Buy
- Sale
- All
- 1
- 2
- 3
- 4
- 5
Double Bottom
was formed on 04.06 at 10:00:11 (UTC+0)
signal strength 4 of 5
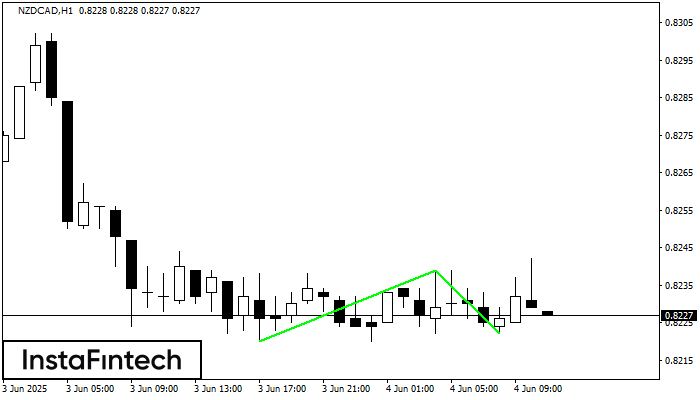
Corak Double Bottom telah dibentuk pada NZDCAD H1; sempadan atas adalah 0.8239; sempadan bawah adalah 0.8222. Lebar corak adalah 19 mata. Sekiranya penembusan sempadan atas 0.8239, perubahan aliran boleh diramalkan
Open chart in a new window
Double Top
was formed on 04.06 at 10:00:01 (UTC+0)
signal strength 4 of 5
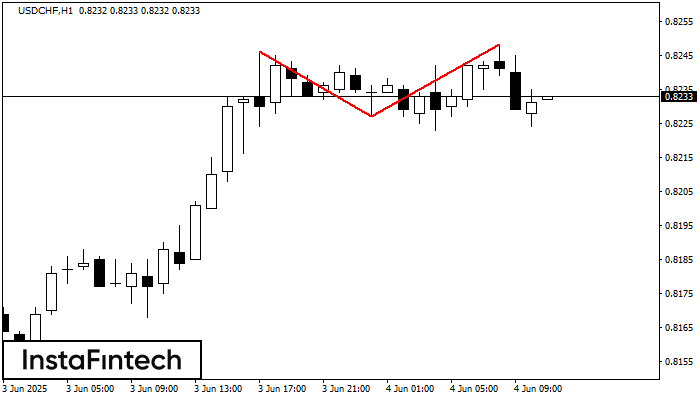
Corak pembalikan Double Top telah dibentuk pada USDCHF H1. Ciri-ciri: sempadan atas %P0.000000; sempadan bawah 0.8246; sempadan bawah 0.8227; lebar corak adalah 21 mata. Dagangan menjual adalah lebih baik untuk
Open chart in a new window
Segi Empat Menaik
was formed on 04.06 at 09:59:16 (UTC+0)
signal strength 3 of 5
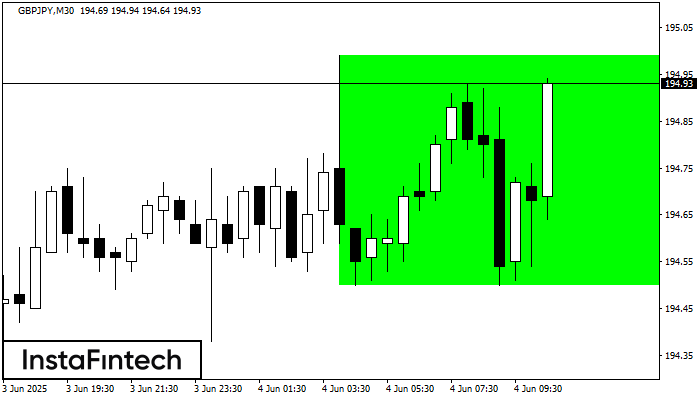
Berdasarkan carta M30, GBPJPY telah membentuk Segi Empat Menaik. Corak ini menunjukkan kesinambungan aliran. Sempadan atas adalah 194.99, sempadan bawah adalah 194.50. Isyarat bermakna bahawa kedudukan panjang perlu dibuka
Open chart in a new window


