

Corak sebenar

Double Bottom
was formed on 04.04 at 17:30:24 (UTC+0)
signal strength 3 of 5
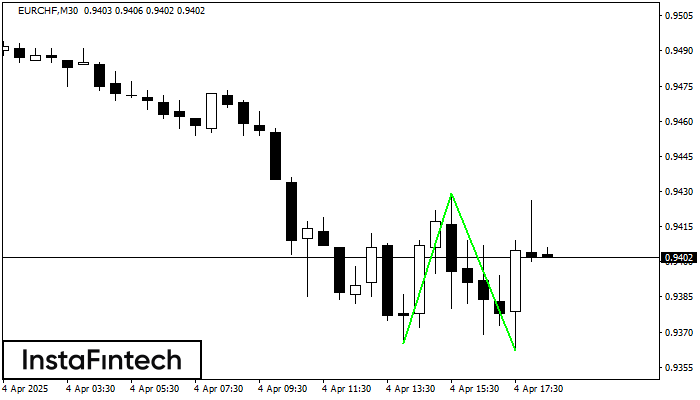
The Double Bottom pattern has been formed on EURCHF M30. Characteristics: the support level 0.9365; the resistance level 0.9429; the width of the pattern 64 points. If the resistance level is broken, a change in the trend can be predicted with the first target point lying at the distance of 67 points.
- All
- All
- Bearish Rectangle
- Bearish Symmetrical Triangle
- Bearish Symmetrical Triangle
- Bullish Rectangle
- Double Top
- Double Top
- Triple Bottom
- Triple Bottom
- Triple Top
- Triple Top
- All
- All
- Buy
- Sale
- All
- 1
- 2
- 3
- 4
- 5
Double Top
was formed on 01.05 at 02:45:07 (UTC+0)
signal strength 2 of 5
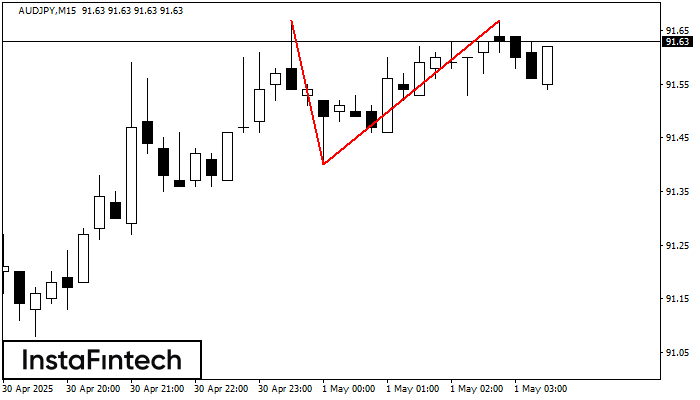
The Double Top reversal pattern has been formed on AUDJPY M15. Characteristics: the upper boundary 91.67; the lower boundary 91.40; the width of the pattern is 27 points. Sell trades
The M5 and M15 time frames may have more false entry points.
Open chart in a new window
Double Bottom
was formed on 01.05 at 02:30:22 (UTC+0)
signal strength 1 of 5
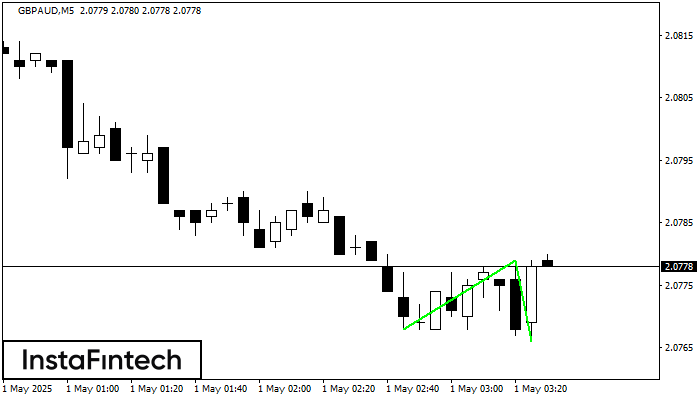
The Double Bottom pattern has been formed on GBPAUD M5. This formation signals a reversal of the trend from downwards to upwards. The signal is that a buy trade should
The M5 and M15 time frames may have more false entry points.
Open chart in a new window
Bullish Symmetrical Triangle
was formed on 01.05 at 01:51:59 (UTC+0)
signal strength 1 of 5
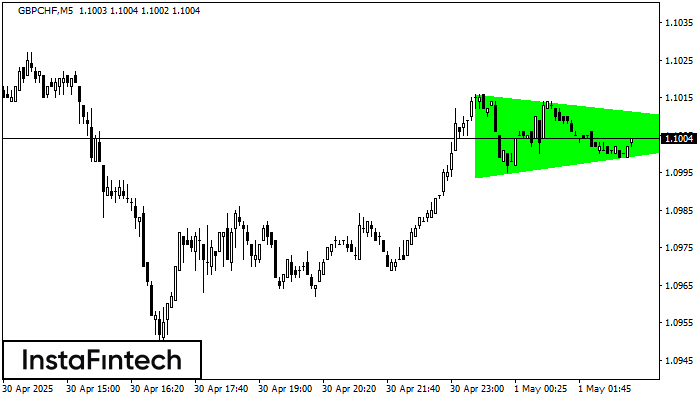
According to the chart of M5, GBPCHF formed the Bullish Symmetrical Triangle pattern. Description: This is the pattern of a trend continuation. 1.1016 and 1.0994 are the coordinates
The M5 and M15 time frames may have more false entry points.
Open chart in a new window

