

Corak sebenar

Bearish pennant
was formed on 03.04 at 20:00:14 (UTC+0)
signal strength 3 of 5
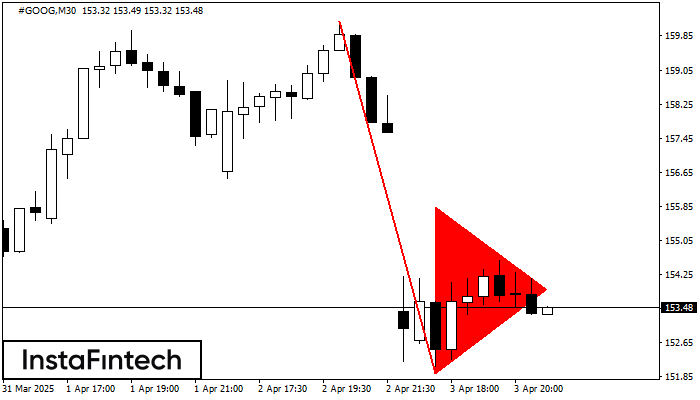
The Bearish pennant pattern has formed on the #GOOG M30 chart. It signals potential continuation of the existing trend. Specifications: the pattern’s bottom has the coordinate of 151.94; the projection of the flagpole height is equal to 824 pips. In case the price breaks out the pattern’s bottom of 151.94, the downtrend is expected to continue for further level 151.64.
Juga lihat
- All
- All
- Bearish Rectangle
- Bearish Symmetrical Triangle
- Bearish Symmetrical Triangle
- Bullish Rectangle
- Double Top
- Double Top
- Triple Bottom
- Triple Bottom
- Triple Top
- Triple Top
- All
- All
- Buy
- Sale
- All
- 1
- 2
- 3
- 4
- 5
Bullish Rectangle
was formed on 30.04 at 21:12:49 (UTC+0)
signal strength 4 of 5

According to the chart of H1, #TSLA formed the Bullish Rectangle. This type of a pattern indicates a trend continuation. It consists of two levels: resistance 294.59 and support 270.55
Open chart in a new window
Bullish Rectangle
was formed on 30.04 at 21:12:27 (UTC+0)
signal strength 4 of 5
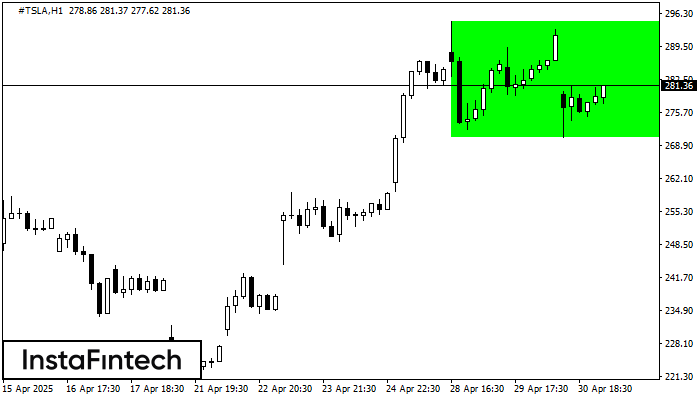
According to the chart of H1, #TSLA formed the Bullish Rectangle. The pattern indicates a trend continuation. The upper border is 294.59, the lower border is 270.55. The signal means
Open chart in a new window
Bullish Rectangle
was formed on 30.04 at 21:12:19 (UTC+0)
signal strength 3 of 5
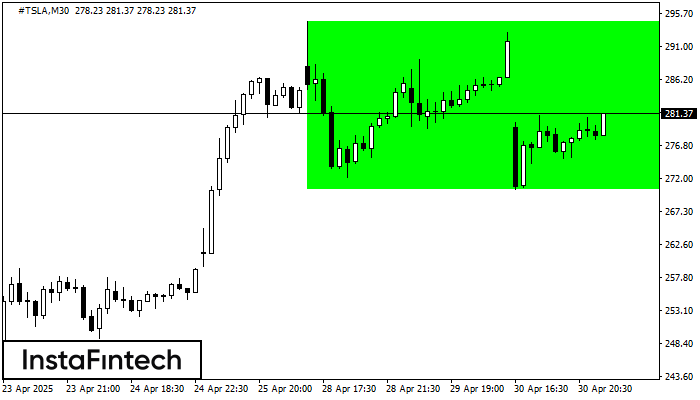
According to the chart of M30, #TSLA formed the Bullish Rectangle. This type of a pattern indicates a trend continuation. It consists of two levels: resistance 294.59 and support 270.55
Open chart in a new window


