

Corak sebenar

Bullish Rectangle
was formed on 02.04 at 06:48:50 (UTC+0)
signal strength 1 of 5
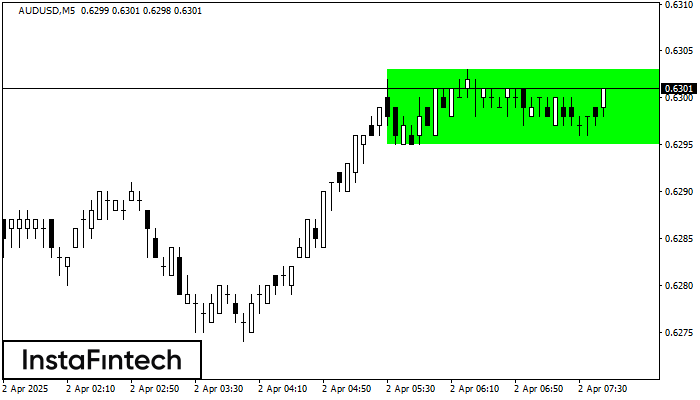
According to the chart of M5, AUDUSD formed the Bullish Rectangle. This type of a pattern indicates a trend continuation. It consists of two levels: resistance 0.6303 and support 0.6295. In case the resistance level 0.6303 - 0.6303 is broken, the instrument is likely to follow the bullish trend.
The M5 and M15 time frames may have more false entry points.
Juga lihat
- All
- All
- Bearish Rectangle
- Bearish Symmetrical Triangle
- Bearish Symmetrical Triangle
- Bullish Rectangle
- Double Top
- Double Top
- Triple Bottom
- Triple Bottom
- Triple Top
- Triple Top
- All
- All
- Buy
- Sale
- All
- 1
- 2
- 3
- 4
- 5
Double Top
was formed on 15.04 at 02:00:21 (UTC+0)
signal strength 4 of 5
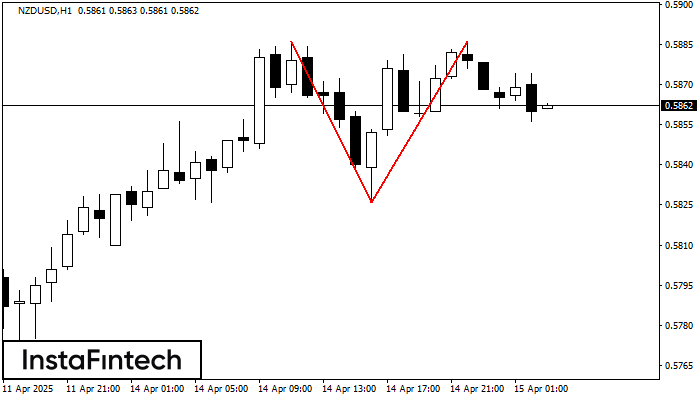
Corak Double Top telah dibentuk pada NZDUSD H1. Isyarat bahawa aliran telah berubah dari aliran menaik ke aliran menurun. Mungkin, sekiranya asas corak 0.5826 ditembusi, pergerakan menurun akan berterusan
Open chart in a new window
Triple Bottom
was formed on 15.04 at 01:15:13 (UTC+0)
signal strength 1 of 5

Corak Triple Bottom telah dibentuk pada #Bitcoin M5. Ia mempunyai ciri-ciri berikut: tahap rintangan 84720.65/84653.62; tahap sokongan 84401.53/84425.81; lebar corak adalah 31912 mata. Dalam situasi penembusan paras rintangan 84720.65, harga
Carta masa M5 dan M15 mungkin mempunyai lebih banyak titik kemasukan palsu.
Open chart in a new window
Triple Bottom
was formed on 15.04 at 01:15:03 (UTC+0)
signal strength 2 of 5
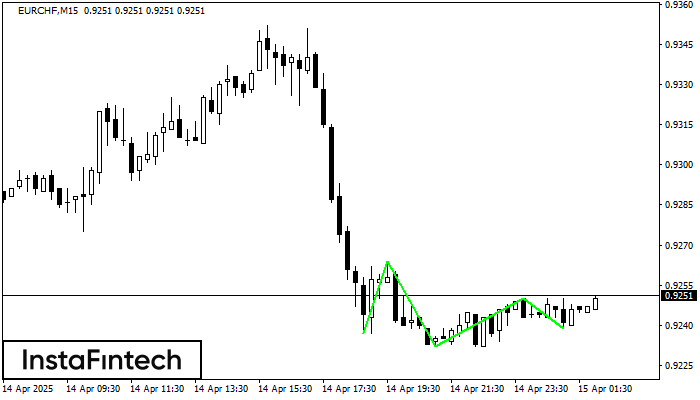
Corak Triple Bottom telah dibentuk pada carta bagi instrumen dagangan EURCHF M15. Corak menandakan perubahan aliran dari menurun ke aliran menaik dalam sekiranya penembusan 0.9264/0.9250
Carta masa M5 dan M15 mungkin mempunyai lebih banyak titik kemasukan palsu.
Open chart in a new window


