

Corak sebenar

Double Bottom
was formed on 24.03 at 20:30:48 (UTC+0)
signal strength 2 of 5
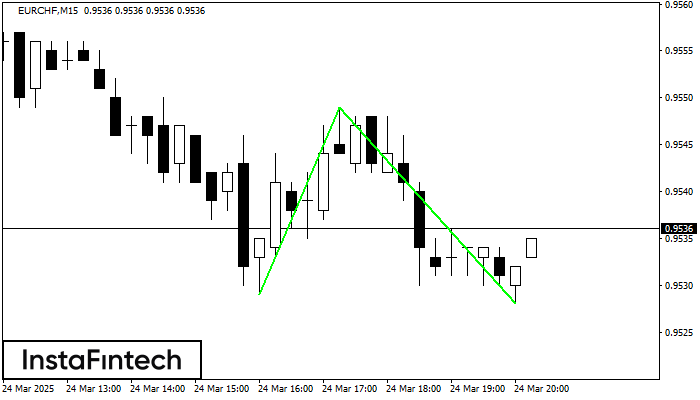
The Double Bottom pattern has been formed on EURCHF M15; the upper boundary is 0.9549; the lower boundary is 0.9528. The width of the pattern is 20 points. In case of a break of the upper boundary 0.9549, a change in the trend can be predicted where the width of the pattern will coincide with the distance to a possible take profit level.
The M5 and M15 time frames may have more false entry points.
Juga lihat
- All
- All
- Bearish Rectangle
- Bearish Symmetrical Triangle
- Bearish Symmetrical Triangle
- Bullish Rectangle
- Double Top
- Double Top
- Triple Bottom
- Triple Bottom
- Triple Top
- Triple Top
- All
- All
- Buy
- Sale
- All
- 1
- 2
- 3
- 4
- 5
Double Bottom
was formed on 29.03 at 11:00:31 (UTC+0)
signal strength 3 of 5

Corak Double Bottom telah dibentuk pada #Bitcoin M30. Ciri-ciri: tahap sokongan 83552.05; tahap rintangan 84588.82; lebar corak 103677 mata. Sekiranya tahap rintangan ditembusi, perubahan aliran boleh diramalkan dengan titik sasaran
Open chart in a new window
Double Bottom
was formed on 29.03 at 10:15:29 (UTC+0)
signal strength 1 of 5

Corak Double Bottom telah dibentuk pada #Bitcoin M5. Ciri-ciri: tahap sokongan 83619.16; tahap rintangan 83858.95; lebar corak 23979 mata. Sekiranya tahap rintangan ditembusi, perubahan aliran boleh diramalkan dengan titik sasaran
Carta masa M5 dan M15 mungkin mempunyai lebih banyak titik kemasukan palsu.
Open chart in a new window
Double Bottom
was formed on 29.03 at 09:45:28 (UTC+0)
signal strength 2 of 5
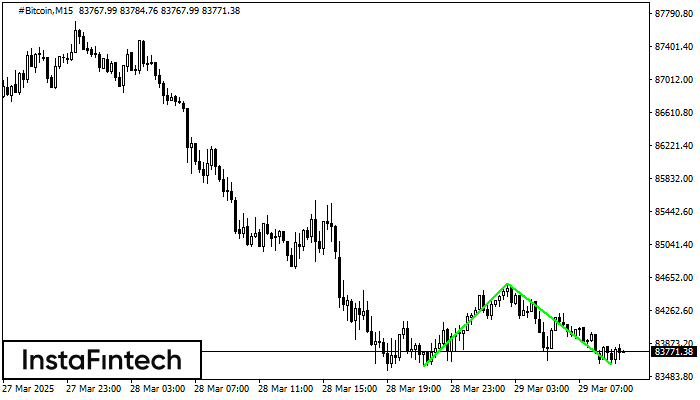
Corak Double Bottom telah dibentuk pada #Bitcoin M15. Pembentukan ini menandakan pembalikan aliran dari aliran menurun ke atas. Isyarat ialah perdagangan membeli harus dibuka selepas sempadan atas corak 84588.82 telah
Carta masa M5 dan M15 mungkin mempunyai lebih banyak titik kemasukan palsu.
Open chart in a new window


