Lihat juga


 28.03.2025 07:52 PM
To open long positions on EUR/USD:
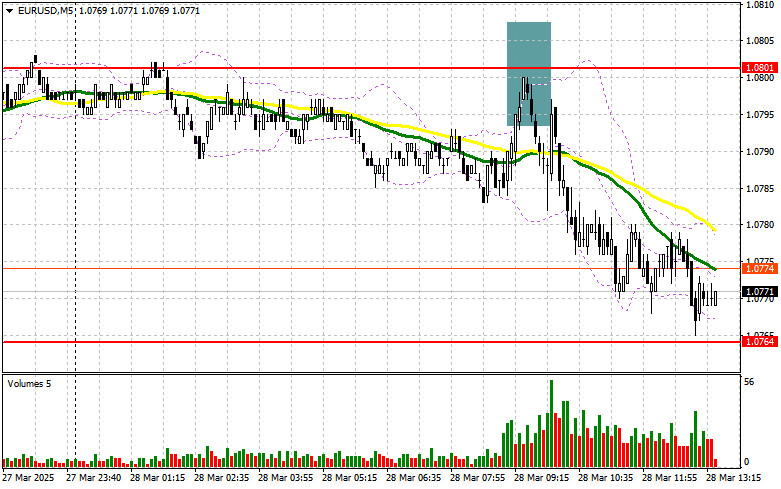
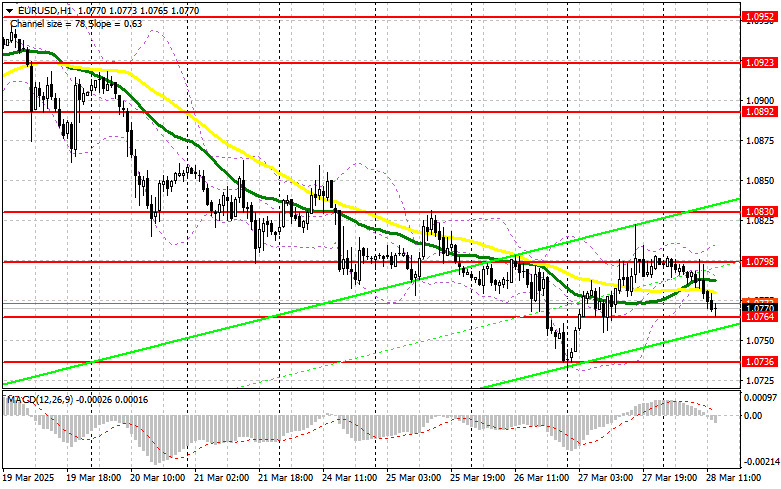
Data from Germany and the labor market disappointed traders, reducing the appeal of the euro and pushing it lower against the U.S. dollar in the first half of the day. However, things could change in the second half as key U.S. inflation indicators are released. These include the core personal consumption expenditures (PCE) index, changes in consumer spending, and changes in personal income. Inflation expectations from the University of Michigan and speeches from FOMC members will wrap up the week. If the euro declines, only a false breakout around the support level of 1.0764 would serve as a signal to buy EUR/USD, aiming for a bullish reversal with a potential return to 1.0798, the resistance formed earlier today. A breakout and retest of this range from above would confirm a correct entry point for further growth toward 1.0830. The ultimate target will be 1.0863, where I plan to take profit. If EUR/USD drops and there is no buying activity around 1.0764—which is more likely—the pair could extend its correction. In that case, sellers may push it to 1.0736. Only after a false breakout there will I consider buying euros. I plan to open long positions from a rebound at 1.0691, targeting an intraday correction of 30–35 points.
To open short positions on EUR/USD:
Sellers made their presence known around key resistance, which could lead to a larger sell-off by the end of the week and a return to weekly lows. This would require strong U.S. statistics. In case of a negative market reaction, only a false breakout around 1.0798 would provide an entry point for short positions targeting a drop to support at 1.0764. A breakout and consolidation below this range would offer another suitable sell signal, aiming for 1.0736. The final target will be 1.0691, where I will take profit. If EUR/USD rises in the second half of the day and bears fail to act around 1.0798, buyers could push the pair higher. In that case, I will delay short entries until a test of the next resistance at 1.0830, where I will sell only after a failed breakout. If no downward movement occurs there either, I will look for short entries on a rebound from 1.0863, aiming for a 30–35 point correction.
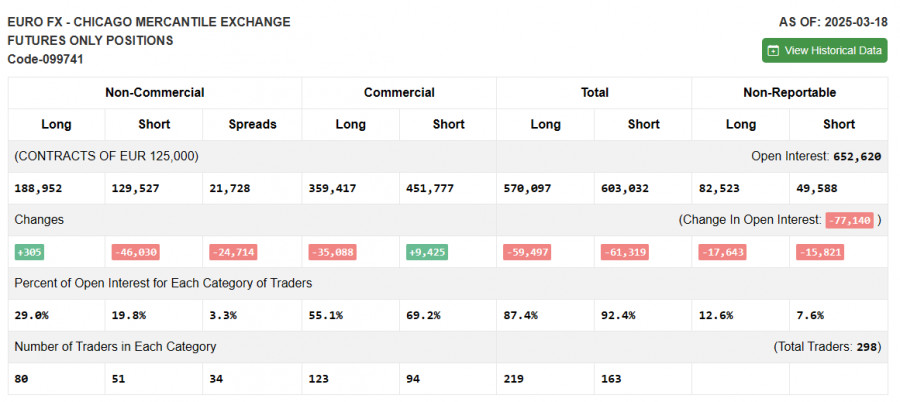
COT Report (Commitment of Traders) for March 18:
The report showed an increase in long positions and a sharp decline in short ones. More traders are willing to buy euros, while sellers continue to exit the market. The European Central Bank's cautious stance on rate cuts and weak U.S. fundamentals forcing the Federal Reserve to pivot to a more dovish monetary policy are driving the shift in market sentiment. The COT report indicates that non-commercial long positions rose by 305 to 188,952, while short positions dropped by 46,030 to 129,527. As a result, the net long position widened by 24,714.
Indicator signals:
Moving Averages: Trading is taking place near the 30- and 50-day moving averages, indicating a sideways market.
Note: The author uses H1 hourly chart settings, which differ from the classical daily moving averages on the D1 chart.
Bollinger Bands: In the event of a decline, the lower band around 1.0765 will serve as support.
Indicator Descriptions:
• Moving average: identifies the current trend by smoothing out volatility and noise (Period – 50; marked in yellow on the chart).
• Moving average: identifies the current trend by smoothing out volatility and noise (Period – 30; marked in green).
• MACD (Moving Average Convergence/Divergence): Fast EMA – 12, Slow EMA – 26, SMA – 9.
• Bollinger Bands: Period – 20.
• Non-commercial traders: speculators such as individual traders, hedge funds, and large institutions using the futures market for speculative purposes under specific criteria.
• Long non-commercial positions: total long open positions held by non-commercial traders.
• Short non-commercial positions: total short open positions held by non-commercial traders.
• Total non-commercial net position: the difference between short and long positions held by non-commercial traders.
You have already liked this post today
* Analisis pasaran yang disiarkan di sini adalah bertujuan untuk meningkatkan kesedaran anda, tetapi tidak untuk memberi arahan untuk membuat perdagangan.
Pada hari Selasa, pasangan GBP/USD kebanyakannya didagangkan mendatar, tetapi awal pagi Rabu ia melonjak ke atas. Pada carta masa 4 jam, jelas bahawa harga masih berada dalam saluran mendatar antara
Analisis Dagangan pada Hari Selasa Carta 1 Jam untuk EUR/USD Pada hari Selasa, pasangan mata wang EUR/USD didagangkan secara mendatar, namun ia menyambung semula pergerakan menaik pada awal pagi Rabu
Analisis GBP/USD carta 5 Minit Pasangan mata wang GBP/USD terus didagangkan dalam julat saluran mendatar pada hari Selasa, yang telah wujud selama lebih sebulan dan jelas kelihatan. Walaupun pada hari
Pasangan mata wang EUR/USD kebanyakannya berdagang secara mendatar sepanjang hari Selasa. Tidak seperti Isnin, para pedagang tidak mempunyai alasan rasmi untuk menjual dolar, sesuatu yang sering mereka lakukan kebelakangan
Analisis Dagangan Hari Isnin Carta 1-Jam pasangan GBP/USD Sepanjang hari Isnin, pasangan GBP/USD meneruskan pergerakan menaiknya, dan pada pandangan pertama, kelihatan seolah-olah satu aliran menaik baharu sedang terbentuk pada carta
Pasangan mata wang EUR/USD melonjak naik pada hari Isnin dengan kekuatan yang diperbaharui. Tetapi apakah yang membenarkan pergerakan ini, memandangkan latar belakang makroekonomi dan asas pada hari Isnin hampir tidak
Analisis 5-Minit pasangan GBP/USD Pasangan mata wang GBP/USD meneruskan pergerakan menaiknya pada hari Isnin, yang bermula sejak minggu lalu. Harga berjaya menembusi kedua-dua garis penunjuk Ichimoku, jadi dari sudut teknikal
Pada hari Isnin, pasangan mata wang EUR/USD menunjukkan kenaikan yang agak ketara. Kami percaya bahawa tiada justifikasi makroekonomi atau fundamental untuk penyusutan nilai dolar A.S. yang begitu mendadak pada hari
Pada hari Jumaat, pasangan mata wang EUR/USD mengalami penurunan harga yang ketara, walaupun tiada sebab makroekonomi atau fundamental. Walau bagaimanapun, aliran menurun pada carta masa setiap jam kekal stabil
Analisis 5-Minit GBP/USD Pada hari Jumaat, pasangan mata wang GBP/USD kebanyakannya didagangkan dalam arah menurun sepanjang hari, namun ditutup dengan penurunan kecil sahaja. Ini sebahagian besarnya disebabkan oleh kelemahan dolar
Kelab InstaTrade

Your IP address shows that you are currently located in the USA. If you are a resident of the United States, you are prohibited from using the services of InstaFintech Group including online trading, online transfers, deposit/withdrawal of funds, etc.
If you think you are seeing this message by mistake and your location is not the US, kindly proceed to the website. Otherwise, you must leave the website in order to comply with government restrictions.
Why does your IP address show your location as the USA?
Please confirm whether you are a US resident or not by clicking the relevant button below. If you choose the wrong option, being a US resident, you will not be able to open an account with InstaTrade anyway.
We are sorry for any inconvenience caused by this message.


