

Өзекті паттерндер

Двойное дно
сформирован 25.04 в 01:59:57 (UTC+0)
сила сигнала 3 из 5
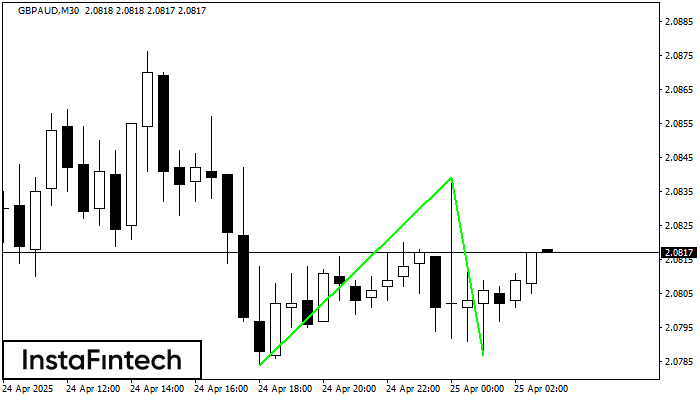
Сформирована фигура «Двойное дно» на графике GBPAUD M30. Характеристика: Уровень поддержки 2.0784; Уровень сопротивления 2.0839; Ширина фигуры 55 пунктов. В случае пробоя уровня сопротивления можно будет прогнозировать изменение тенденции, где первая точка фиксации прибыли находится на расстоянии 52 пунктов.
Сондай-ақ қараңыз
- Все
- Все
- Bearish Rectangle
- Bearish Symmetrical Triangle
- Bearish Symmetrical Triangle
- Bullish Rectangle
- Double Top
- Double Top
- Triple Bottom
- Triple Bottom
- Triple Top
- Triple Top
- Все
- Все
- Покупка
- Продажа
- Все
- 1
- 2
- 3
- 4
- 5
Double Top
сформирован 03.06 в 22:30:18 (UTC+0)
сила сигнала 2 из 5
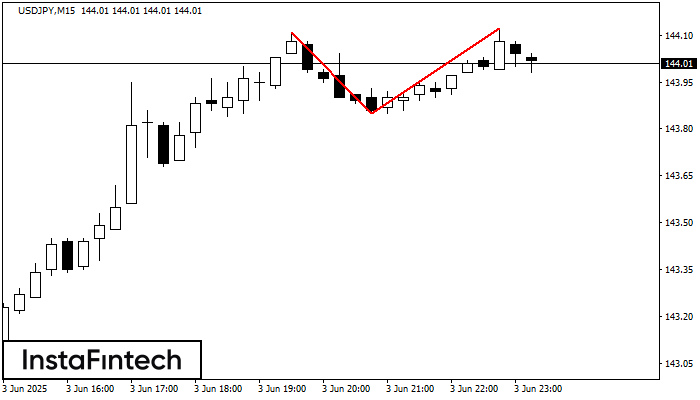
The Double Top reversal pattern has been formed on USDJPY M15. Characteristics: the upper boundary 144.11; the lower boundary 143.85; the width of the pattern is 27 points. Sell trades
The M5 and M15 time frames may have more false entry points.
Открыть график инструмента в новом окне
Double Top
сформирован 03.06 в 22:30:15 (UTC+0)
сила сигнала 2 из 5
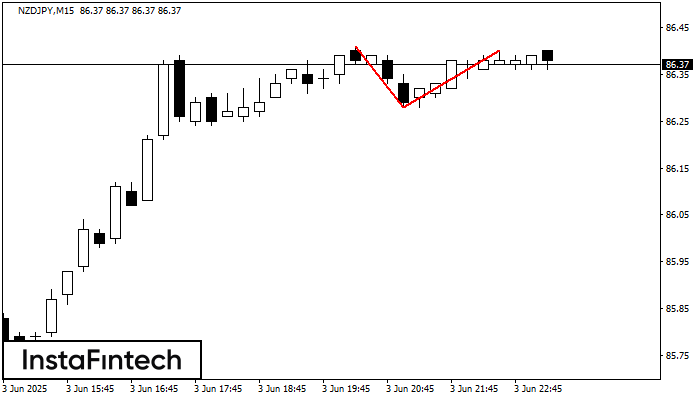
On the chart of NZDJPY M15 the Double Top reversal pattern has been formed. Characteristics: the upper boundary 86.40; the lower boundary 86.28; the width of the pattern 12 points
The M5 and M15 time frames may have more false entry points.
Открыть график инструмента в новом окне
Bearish Symmetrical Triangle
сформирован 03.06 в 22:07:06 (UTC+0)
сила сигнала 2 из 5
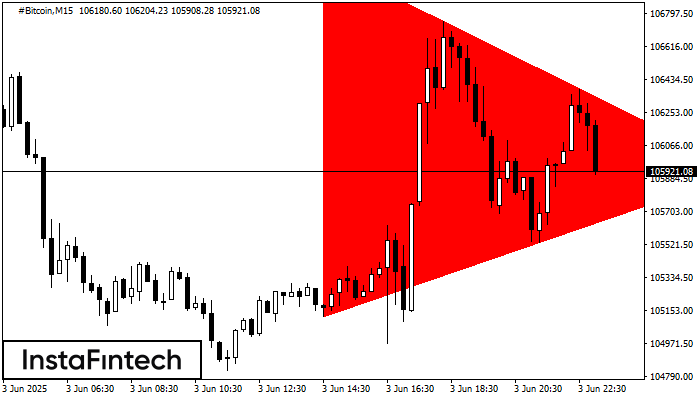
According to the chart of M15, #Bitcoin formed the Bearish Symmetrical Triangle pattern. Description: The lower border is 105120.25/105921.53 and upper border is 107085.82/105921.53. The pattern width is measured
The M5 and M15 time frames may have more false entry points.
Открыть график инструмента в новом окне


