

Өзекті паттерндер

Медвежий симметричный треугольник
сформирован 22.04 в 00:27:05 (UTC+0)
сила сигнала 3 из 5

По USDJPY M30 сформировалась фигура «Медвежий симметричный треугольник». Данная фигура сигнализирует нам о продолжении нисходящего тренда в случае пробоя нижней границы 140.49, где вероятная прибыль будет являться шириной текущей фигуры -61 пунктов.
Сондай-ақ қараңыз
- Все
- Все
- Bearish Rectangle
- Bearish Symmetrical Triangle
- Bearish Symmetrical Triangle
- Bullish Rectangle
- Double Top
- Double Top
- Triple Bottom
- Triple Bottom
- Triple Top
- Triple Top
- Все
- Все
- Покупка
- Продажа
- Все
- 1
- 2
- 3
- 4
- 5
Double Top
was formed on 02.06 at 23:00:37 (UTC+0)
signal strength 5 of 5
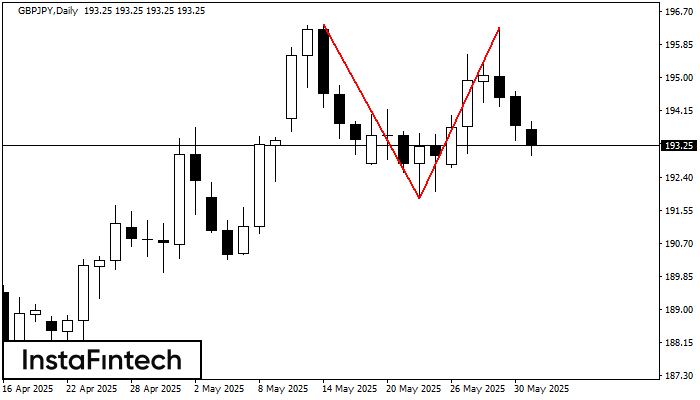
The Double Top reversal pattern has been formed on GBPJPY D1. Characteristics: the upper boundary 196.38; the lower boundary 191.87; the width of the pattern is 441 points. Sell trades
Open chart in a new window
Double Bottom
was formed on 02.06 at 23:00:22 (UTC+0)
signal strength 2 of 5
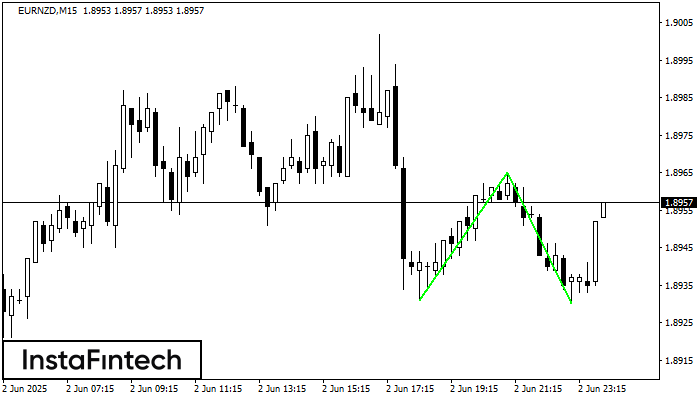
The Double Bottom pattern has been formed on EURNZD M15. Characteristics: the support level 1.8931; the resistance level 1.8965; the width of the pattern 34 points. If the resistance level
The M5 and M15 time frames may have more false entry points.
Open chart in a new window
Bullish Rectangle
was formed on 02.06 at 22:15:32 (UTC+0)
signal strength 4 of 5
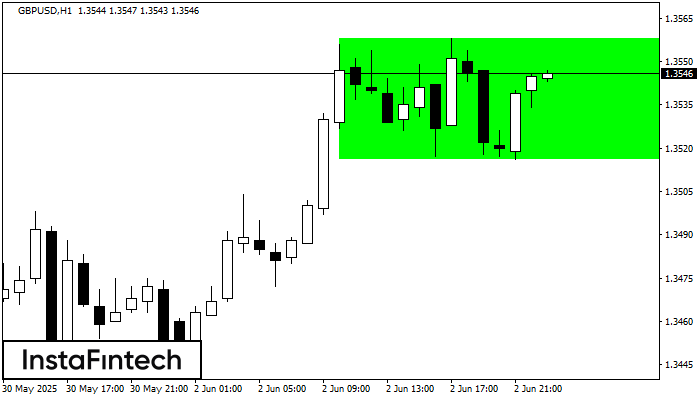
According to the chart of H1, GBPUSD formed the Bullish Rectangle. This type of a pattern indicates a trend continuation. It consists of two levels: resistance 1.3558 and support 1.3516
Open chart in a new window


