

Өзекті паттерндер

Двойное дно
сформирован 18.04 в 18:15:46 (UTC+0)
сила сигнала 2 из 5

Сформирована фигура «Двойное дно» на графике GBPCHF M15. Данное формирование сигнализирует об изменении тенденции с нисходящего на восходящее движение. Сигнал: Торговую позицию на покупку следует открывать после пробоя верхней границы фигуры 1.0871, где перспектива будущего хода будет являться шириной текущей фигуры - 25 пунктов.
Таймфреймы М5 и М15 могут иметь больше ложных точек входа.
Сондай-ақ қараңыз
- Все
- Все
- Bearish Rectangle
- Bearish Symmetrical Triangle
- Bearish Symmetrical Triangle
- Bullish Rectangle
- Double Top
- Double Top
- Triple Bottom
- Triple Bottom
- Triple Top
- Triple Top
- Все
- Все
- Покупка
- Продажа
- Все
- 1
- 2
- 3
- 4
- 5
Bearish pennant
сформирован 01.05 в 00:45:24 (UTC+0)
сила сигнала 1 из 5
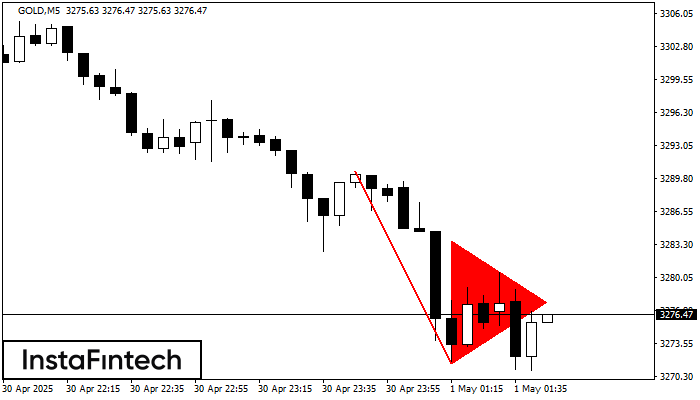
The Bearish pennant pattern has formed on the GOLD M5 chart. It signals potential continuation of the existing trend. Specifications: the pattern’s bottom has the coordinate of 3271.62; the projection
The M5 and M15 time frames may have more false entry points.
Открыть график инструмента в новом окне
Bearish Rectangle
сформирован 30.04 в 23:45:43 (UTC+0)
сила сигнала 1 из 5
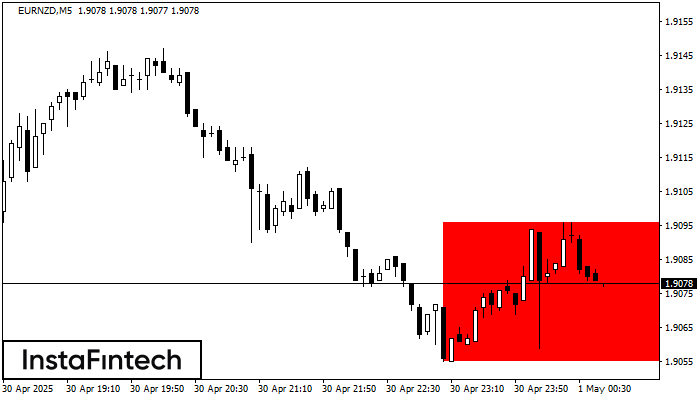
According to the chart of M5, EURNZD formed the Bearish Rectangle. This type of a pattern indicates a trend continuation. It consists of two levels: resistance 1.9096 - 0.0000
The M5 and M15 time frames may have more false entry points.
Открыть график инструмента в новом окне
Double Top
сформирован 30.04 в 23:00:21 (UTC+0)
сила сигнала 5 из 5

On the chart of NZDCAD D1 the Double Top reversal pattern has been formed. Characteristics: the upper boundary 0.8316; the lower boundary 0.7826; the width of the pattern 490 points
Открыть график инструмента в новом окне


