

Өзекті паттерндер

Двойное дно
сформирован 17.04 в 15:29:57 (UTC+0)
сила сигнала 2 из 5

Сформирована фигура «Двойное дно» на графике #EBAY M15. Верхняя граница 67.35; Нижняя граница 65.16; Ширина фигуры 215 пунктов. В случае пробоя верхней границы 67.35 можно будет прогнозировать изменение тенденции, где ширина фигуры и будет являться расстоянием предположительного Тейк Профита.
Таймфреймы М5 и М15 могут иметь больше ложных точек входа.
- Все
- Все
- Bearish Rectangle
- Bearish Symmetrical Triangle
- Bearish Symmetrical Triangle
- Bullish Rectangle
- Double Top
- Double Top
- Triple Bottom
- Triple Bottom
- Triple Top
- Triple Top
- Все
- Все
- Покупка
- Продажа
- Все
- 1
- 2
- 3
- 4
- 5
Double Bottom
was formed on 21.06 at 20:40:40 (UTC+0)
signal strength 1 of 5
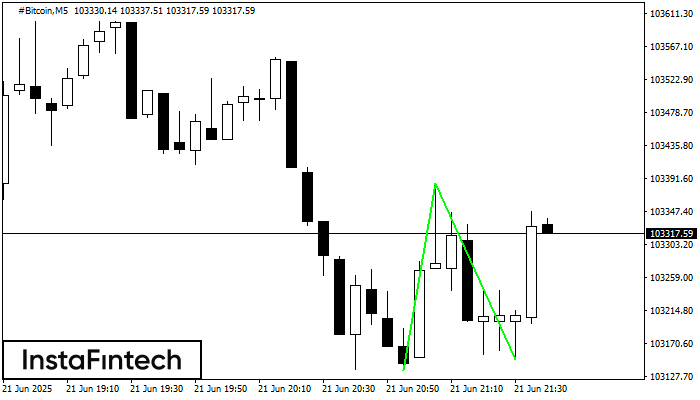
The Double Bottom pattern has been formed on #Bitcoin M5; the upper boundary is 103384.03; the lower boundary is 103150.22. The width of the pattern is 24856 points. In case
The M5 and M15 time frames may have more false entry points.
Open chart in a new window
Bullish Symmetrical Triangle
was formed on 21.06 at 15:17:59 (UTC+0)
signal strength 1 of 5
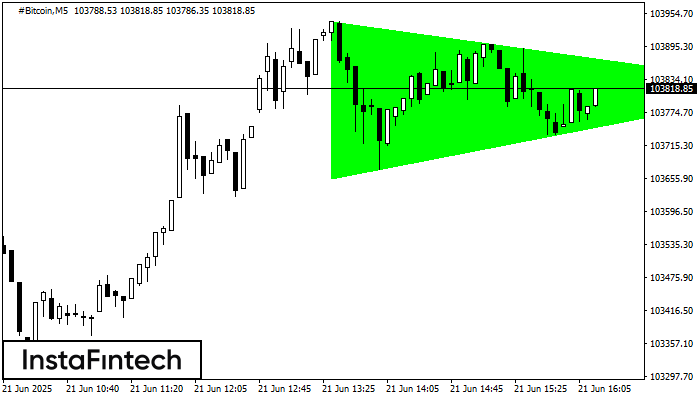
According to the chart of M5, #Bitcoin formed the Bullish Symmetrical Triangle pattern. The lower border of the pattern touches the coordinates 103655.19/103820.77 whereas the upper border goes across 103940.04/103820.77
The M5 and M15 time frames may have more false entry points.
Open chart in a new window
Triple Bottom
was formed on 20.06 at 22:20:23 (UTC+0)
signal strength 1 of 5

The Triple Bottom pattern has been formed on GOLD M5. It has the following characteristics: resistance level 3372.86/3370.25; support level 3364.73/3364.26; the width is 813 points. In the event
The M5 and M15 time frames may have more false entry points.
Open chart in a new window


