

Өзекті паттерндер

Двойное дно
сформирован 04.04 в 17:30:24 (UTC+0)
сила сигнала 3 из 5
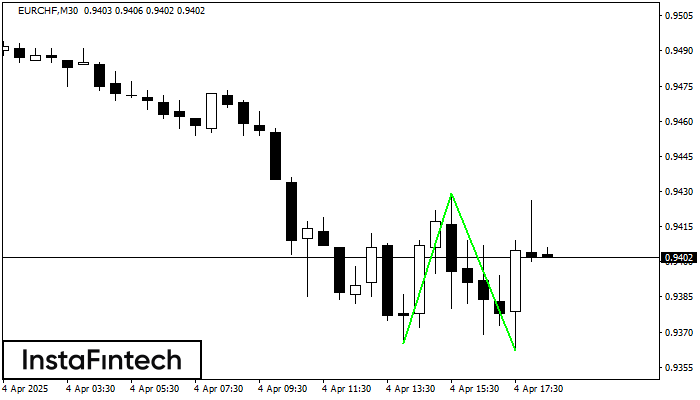
Сформирована фигура «Двойное дно» на графике EURCHF M30. Характеристика: Уровень поддержки 0.9365; Уровень сопротивления 0.9429; Ширина фигуры 64 пунктов. В случае пробоя уровня сопротивления можно будет прогнозировать изменение тенденции, где первая точка фиксации прибыли находится на расстоянии 67 пунктов.
Сондай-ақ қараңыз
- Все
- Все
- Bearish Rectangle
- Bearish Symmetrical Triangle
- Bearish Symmetrical Triangle
- Bullish Rectangle
- Double Top
- Double Top
- Triple Bottom
- Triple Bottom
- Triple Top
- Triple Top
- Все
- Все
- Покупка
- Продажа
- Все
- 1
- 2
- 3
- 4
- 5
Double Top
was formed on 01.05 at 02:45:07 (UTC+0)
signal strength 2 of 5
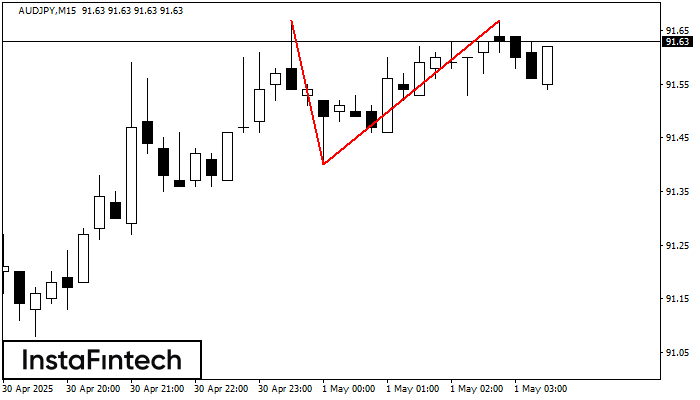
The Double Top reversal pattern has been formed on AUDJPY M15. Characteristics: the upper boundary 91.67; the lower boundary 91.40; the width of the pattern is 27 points. Sell trades
The M5 and M15 time frames may have more false entry points.
Open chart in a new window
Double Bottom
was formed on 01.05 at 02:30:22 (UTC+0)
signal strength 1 of 5
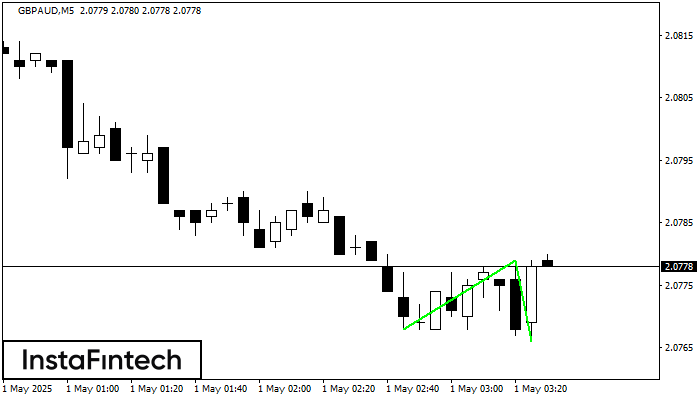
The Double Bottom pattern has been formed on GBPAUD M5. This formation signals a reversal of the trend from downwards to upwards. The signal is that a buy trade should
The M5 and M15 time frames may have more false entry points.
Open chart in a new window
Bullish Symmetrical Triangle
was formed on 01.05 at 01:51:59 (UTC+0)
signal strength 1 of 5
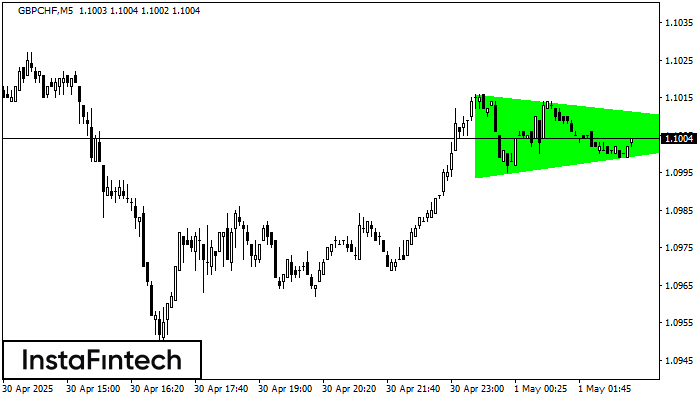
According to the chart of M5, GBPCHF formed the Bullish Symmetrical Triangle pattern. Description: This is the pattern of a trend continuation. 1.1016 and 1.0994 are the coordinates
The M5 and M15 time frames may have more false entry points.
Open chart in a new window


