

Өзекті паттерндер

Двойное дно
сформирован 31.03 в 16:55:23 (UTC+0)
сила сигнала 1 из 5
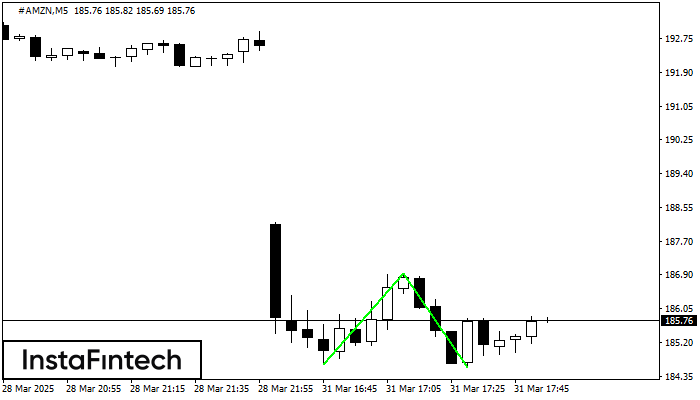
Сформирована фигура «Двойное дно» на графике #AMZN M5. Данное формирование сигнализирует об изменении тенденции с нисходящего на восходящее движение. Сигнал: Торговую позицию на покупку следует открывать после пробоя верхней границы фигуры 186.91, где перспектива будущего хода будет являться шириной текущей фигуры - 226 пунктов.
Таймфреймы М5 и М15 могут иметь больше ложных точек входа.
Сондай-ақ қараңыз
- Все
- Все
- Bearish Rectangle
- Bearish Symmetrical Triangle
- Bearish Symmetrical Triangle
- Bullish Rectangle
- Double Top
- Double Top
- Triple Bottom
- Triple Bottom
- Triple Top
- Triple Top
- Все
- Все
- Покупка
- Продажа
- Все
- 1
- 2
- 3
- 4
- 5
Bearish Rectangle
was formed on 08.04 at 05:46:20 (UTC+0)
signal strength 1 of 5
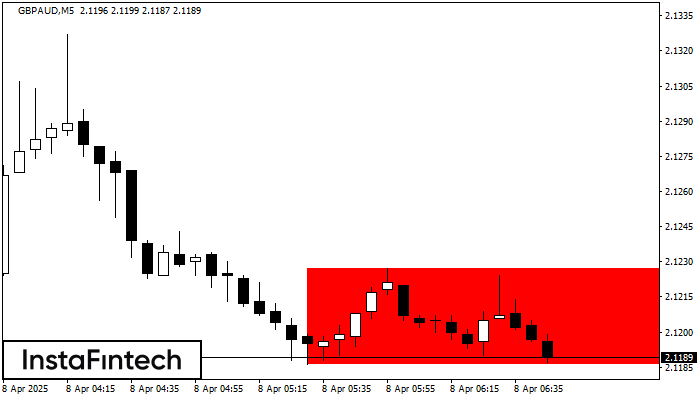
According to the chart of M5, GBPAUD formed the Bearish Rectangle. The pattern indicates a trend continuation. The upper border is 2.1227, the lower border is 2.1186. The signal means
The M5 and M15 time frames may have more false entry points.
Open chart in a new window
Triple Top
was formed on 08.04 at 05:00:22 (UTC+0)
signal strength 1 of 5
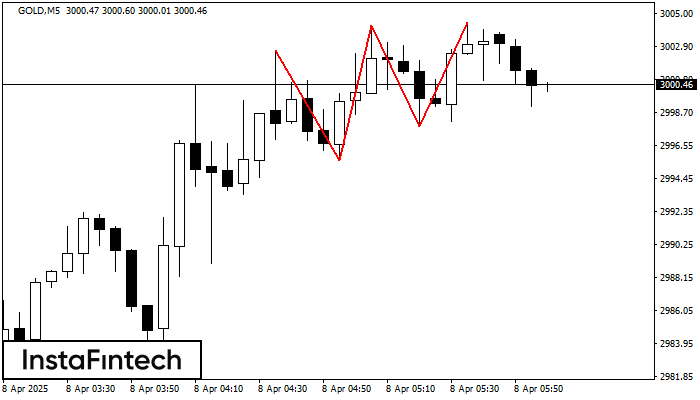
On the chart of the GOLD M5 trading instrument, the Triple Top pattern that signals a trend change has formed. It is possible that after formation of the third peak
The M5 and M15 time frames may have more false entry points.
Open chart in a new window
Double Bottom
was formed on 08.04 at 04:50:18 (UTC+0)
signal strength 1 of 5
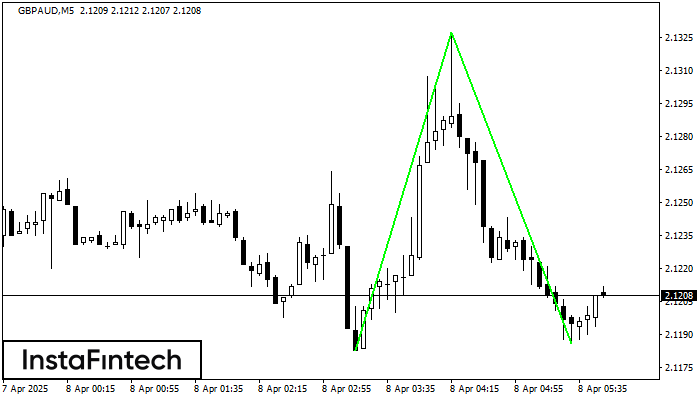
The Double Bottom pattern has been formed on GBPAUD M5; the upper boundary is 2.1327; the lower boundary is 2.1186. The width of the pattern is 144 points. In case
The M5 and M15 time frames may have more false entry points.
Open chart in a new window


