

Өзекті паттерндер

Медвежий вымпел
сформирован 24.03 в 19:35:13 (UTC+0)
сила сигнала 1 из 5
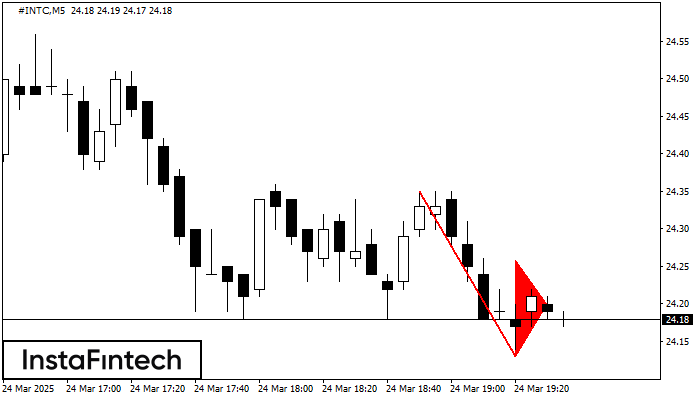
На графике #INTC M5 сформировалась фигура «Медвежий вымпел». Фигура сигнализирует о продолжении нисходящего тренда в случае пробоя минимума вымпела 24.13. Рекомендации: Отложенный ордер Sell Stop выставляется на 10 пунктов ниже минимума фигуры. Тейк Профит выставляется на расстояние проекции высоты флагштока.
Таймфреймы М5 и М15 могут иметь больше ложных точек входа.
- Все
- Все
- Bearish Rectangle
- Bearish Symmetrical Triangle
- Bearish Symmetrical Triangle
- Bullish Rectangle
- Double Top
- Double Top
- Triple Bottom
- Triple Bottom
- Triple Top
- Triple Top
- Все
- Все
- Покупка
- Продажа
- Все
- 1
- 2
- 3
- 4
- 5
Bearish Rectangle
was formed on 30.04 at 23:45:43 (UTC+0)
signal strength 1 of 5
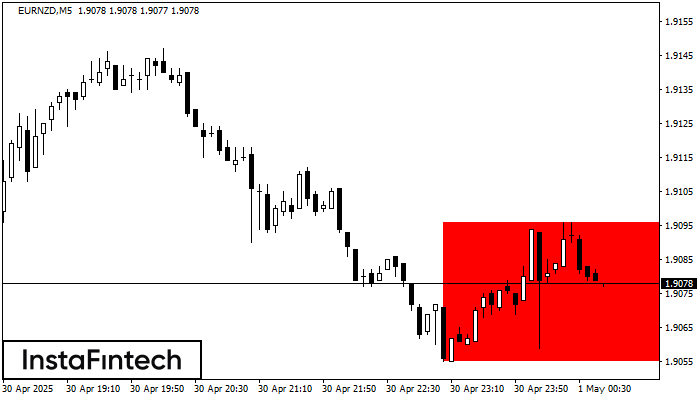
According to the chart of M5, EURNZD formed the Bearish Rectangle. This type of a pattern indicates a trend continuation. It consists of two levels: resistance 1.9096 - 0.0000
The M5 and M15 time frames may have more false entry points.
Open chart in a new window
Double Top
was formed on 30.04 at 23:00:21 (UTC+0)
signal strength 5 of 5

On the chart of NZDCAD D1 the Double Top reversal pattern has been formed. Characteristics: the upper boundary 0.8316; the lower boundary 0.7826; the width of the pattern 490 points
Open chart in a new window
Triple Bottom
was formed on 30.04 at 22:40:20 (UTC+0)
signal strength 1 of 5
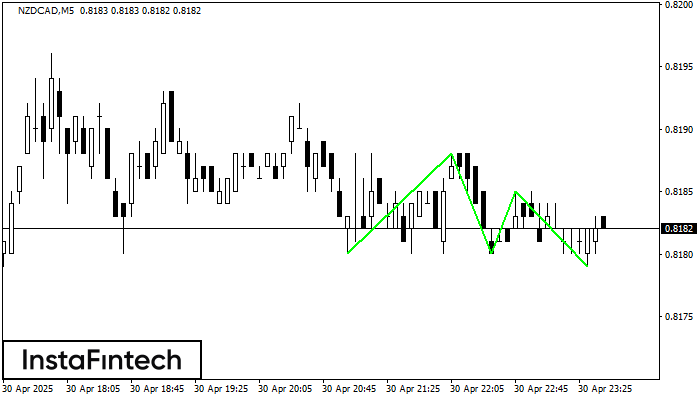
The Triple Bottom pattern has been formed on NZDCAD M5. It has the following characteristics: resistance level 0.8188/0.8185; support level 0.8180/0.8179; the width is 8 points. In the event
The M5 and M15 time frames may have more false entry points.
Open chart in a new window


