

Өзекті паттерндер

Актуальные паттерны
- Все
- Все
- Bearish Rectangle
- Bearish Symmetrical Triangle
- Bearish Symmetrical Triangle
- Bullish Rectangle
- Double Top
- Double Top
- Triple Bottom
- Triple Bottom
- Triple Top
- Triple Top
- Все
- Все
- Покупка
- Продажа
- Все
- 1
- 2
- 3
- 4
- 5
হেড অ্যান্ড শোল্ডার্স
was formed on 17.04 at 18:45:16 (UTC+0)
signal strength 2 of 5
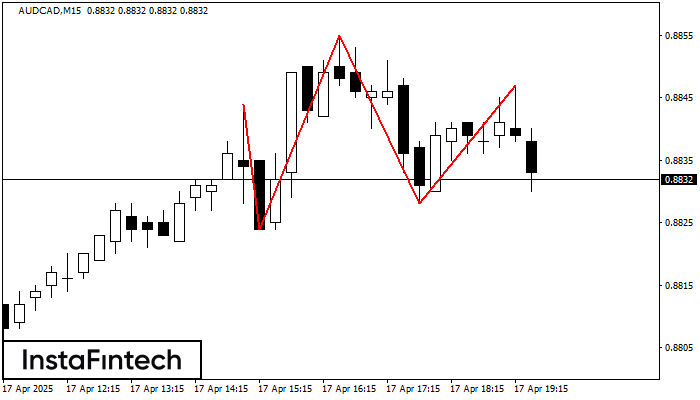
M15 চার্টে, AUDCAD নিম্নলিখিত ফিচারগুলোর সাথে হেড অ্যান্ড শোল্ডার্স প্যাটার্ন তৈরি করেছে: হেডের টপ 0.8855, নেকলাইন এবং ঊর্ধ্বমুখী অ্যাঙ্গেল 0.8824/0.8828-এ রয়েছে। এই প্যাটার্নের গঠন বর্তমান প্রবণতা বুলিশ থেকে বিয়ারিশে পরিবর্তন
M5 এবং M15 টাইম ফ্রেমে আরও ভুল এন্ট্রি পয়েন্ট থাকতে পারে।
Open chart in a new window
ট্রিপল টপ
was formed on 17.04 at 18:45:16 (UTC+0)
signal strength 1 of 5
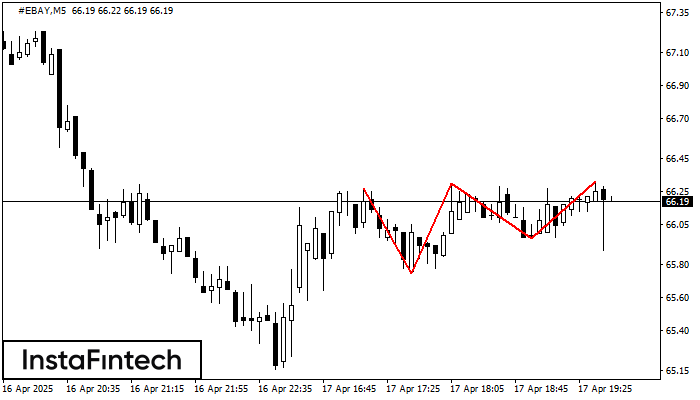
M5 চার্টে #EBAY-এর ট্রিপল টপ প্যাটার্নটি গঠিত হয়েছে। প্যাটার্নের বৈশিষ্ট্য: এই প্যাটার্নের সীমানাগুলোতে একটি ঊর্ধ্বমুখী অ্যাঙ্গেল বা কোণ আছে; প্যাটার্নের নীচের লাইনে 65.75/65.96-এর কোঅর্ডিনেট রয়েছে, উপরের সীমা 66.27/66.31; প্রস্থের প্রজেকশন
M5 এবং M15 টাইম ফ্রেমে আরও ভুল এন্ট্রি পয়েন্ট থাকতে পারে।
Open chart in a new window
ডাবল বটম
was formed on 17.04 at 18:45:14 (UTC+0)
signal strength 2 of 5
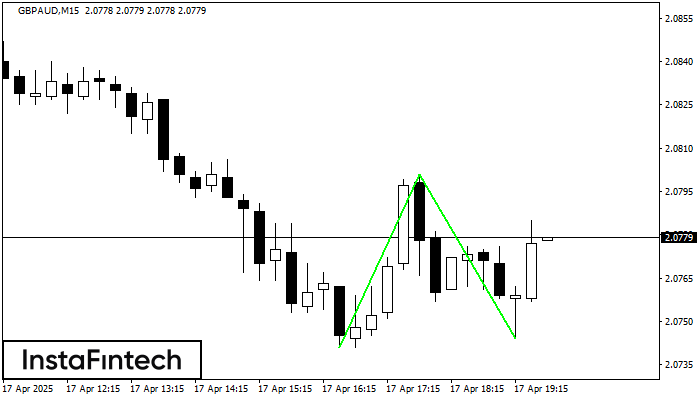
M15 চার্টে, GBPAUD-এর ডাবল বটম প্যাটার্নটি গঠিত হয়েছে। উপরের সীমানা হল 2.0801; নীচের সীমানা হল 2.0744। প্যাটার্নের প্রস্থ হল 60 পয়েন্ট। 2.0801-এর উপরের সীমানা ভেদ করার ক্ষেত্রে, প্রবণতা পরিবর্তনের পূর্বাভাস
M5 এবং M15 টাইম ফ্রেমে আরও ভুল এন্ট্রি পয়েন্ট থাকতে পারে।
Open chart in a new window
বিয়ারিশ ফ্ল্যাগ
was formed on 17.04 at 18:36:16 (UTC+0)
signal strength 5 of 5
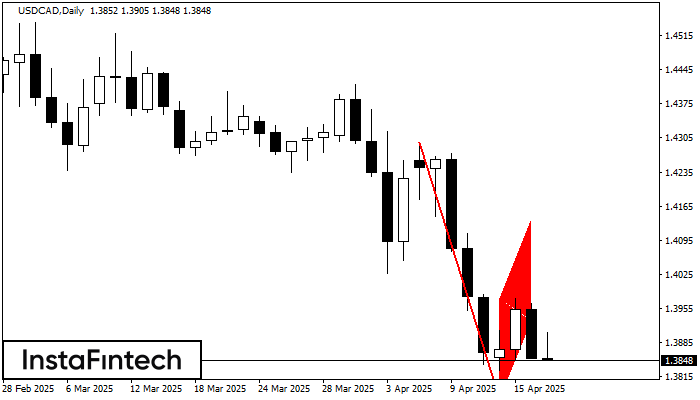
D1 চার্টে USDCAD-এর বিয়ারিশ ফ্ল্যাগ প্যাটার্ন গঠিত হয়েছে যা নিম্নমুখী প্রবণতা অব্যাহত থাকার ইঙ্গিত দেয়। যদি মূল্য 1.3767-এর সর্বনিম্ন স্তরের নীচে ব্রেক করে, তাহলে মূল্যের আরও নীচের দিকে যাওয়ার সম্ভাবনা
Open chart in a new window
বিয়ারিশ পেন্যান্ট
was formed on 17.04 at 18:36:12 (UTC+0)
signal strength 5 of 5
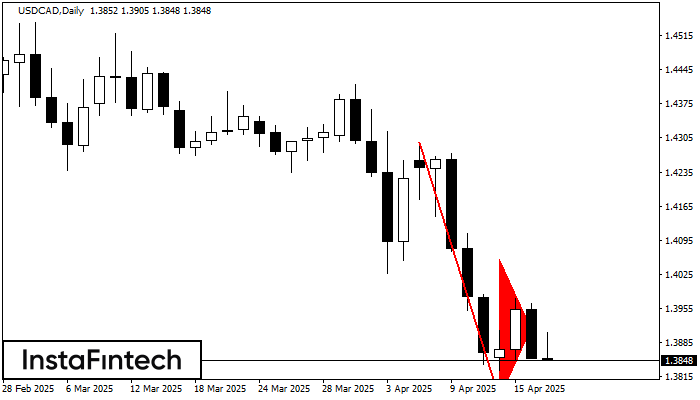
D1 চার্টে USDCAD-এর বিয়ারিশ পেন্যান্ট প্যাটার্ন গঠিত হয়েছে৷ এটি বিদ্যমান প্রবণতার সম্ভাব্য ধারাবাহিকতার ইঙ্গিত দেয়। স্পেসিফিকেশন: প্যাটার্নের নীচে 1.3767 কোঅর্ডিনেশন রয়েছে; ফ্ল্যাগপোলের উচ্চতার প্রজেকশন 528 পিপসের সমান। যদি এই প্যাটার্নের
Open chart in a new window
ডাবল টপ
was formed on 17.04 at 18:15:13 (UTC+0)
signal strength 1 of 5
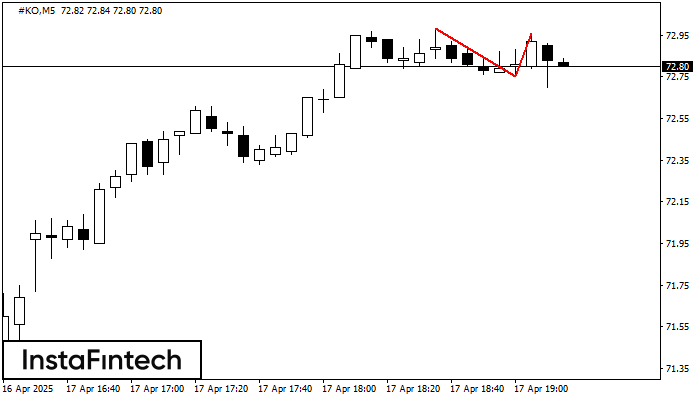
M5 চার্টে, #KO-এর ডাবল টপ রিভার্সাল বা বিপরীতমুখী প্যাটার্ন গঠিত হয়েছে। বৈশিষ্ট্য: উপরের সীমানা 72.96; নীচের সীমানা 72.75; প্যাটার্নের প্রস্থ 21 পয়েন্ট। সংকেত: নীচের সীমানা ব্রেক করা হলে 72.60 স্তরের
M5 এবং M15 টাইম ফ্রেমে আরও ভুল এন্ট্রি পয়েন্ট থাকতে পারে।
Open chart in a new window
ডাবল বটম
was formed on 17.04 at 18:00:01 (UTC+0)
signal strength 1 of 5
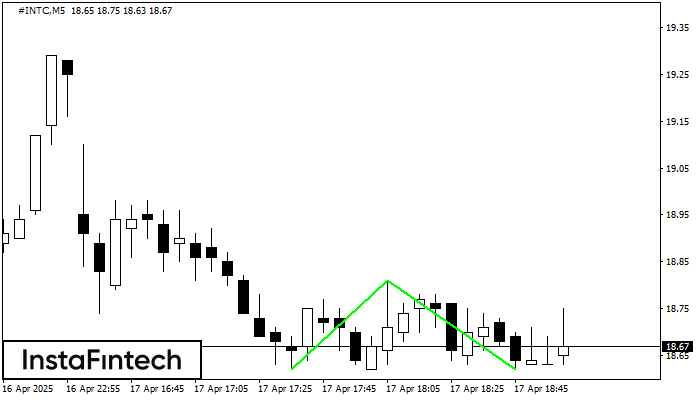
M5 চার্টে, #INTC-এর ডাবল বটম প্যাটার্নটি গঠিত হয়েছে। উপরের সীমানা হল 18.81; নীচের সীমানা হল 18.62। প্যাটার্নের প্রস্থ হল 19 পয়েন্ট। 18.81-এর উপরের সীমানা ভেদ করার ক্ষেত্রে, প্রবণতা পরিবর্তনের পূর্বাভাস
M5 এবং M15 টাইম ফ্রেমে আরও ভুল এন্ট্রি পয়েন্ট থাকতে পারে।
Open chart in a new window
ট্রিপল টপ
was formed on 17.04 at 17:45:29 (UTC+0)
signal strength 1 of 5

M5 চার্টে, NZDCAD ট্রেডিং ইন্সট্রুমেন্টের ট্রিপল টপ প্যাটার্ন প্রবণতা পরিবর্তনের ইঙ্গিত দেয়। তৃতীয় পিকের গঠনের পরে, মূল্য 0.8255-এর রেজিস্ট্যান্স স্তর ভেদ করার প্রচেষ্টা চালানোর সম্ভাবনা রয়েছে, এক্ষেত্রে আমরা সেল করার
M5 এবং M15 টাইম ফ্রেমে আরও ভুল এন্ট্রি পয়েন্ট থাকতে পারে।
Open chart in a new window
ইনভার্স হেড অ্যান্ড শোল্ডার্স
was formed on 17.04 at 17:44:51 (UTC+0)
signal strength 1 of 5
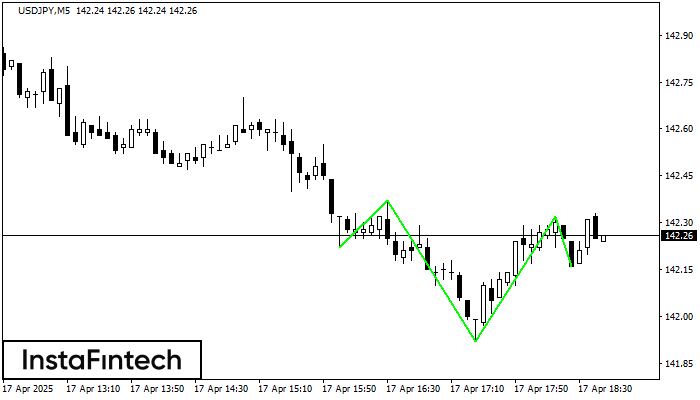
M5 চার্ট অনুযায়ী, USDJPY-এর ইনভার্স হেড অ্যান্ড শোল্ডার্স প্যাটার্ন গঠিত হয়েছে। হেড 141.92 -এ নির্ধারণ করা হয়েছে এবং নেকের মিডিয়ান লাইন 142.37/142.32 -এ নির্ধারণ করা হয়েছে। ইনভার্স হেড অ্যান্ড শোল্ডার্স
M5 এবং M15 টাইম ফ্রেমে আরও ভুল এন্ট্রি পয়েন্ট থাকতে পারে।
Open chart in a new window


