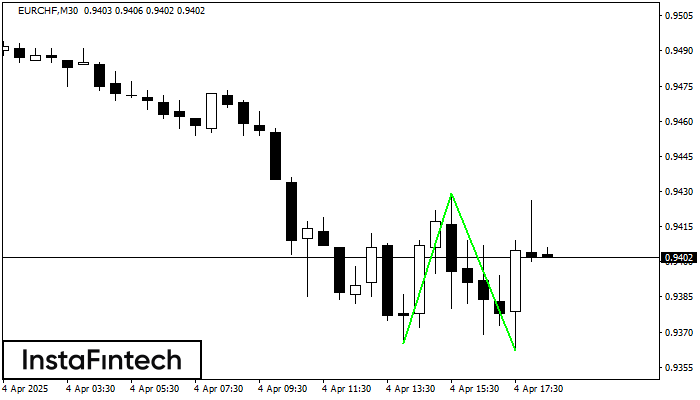
Double Bottom
was formed on 04.04 at 17:30:24 (UTC+0)
signal strength 3 of 5

The Double Bottom pattern has been formed on EURCHF M30. Characteristics: the support level 0.9365; the resistance level 0.9429; the width of the pattern 64 points. If the resistance level is broken, a change in the trend can be predicted with the first target point lying at the distance of 67 points.
See Also
- All
- All
- Bearish Rectangle
- Bearish Symmetrical Triangle
- Bearish Symmetrical Triangle
- Bullish Rectangle
- Double Top
- Double Top
- Triple Bottom
- Triple Bottom
- Triple Top
- Triple Top
- All
- All
- Buy
- Sale
- All
- 1
- 2
- 3
- 4
- 5
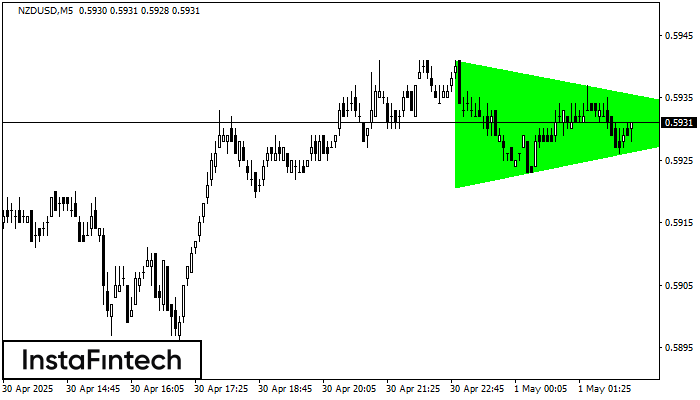
बुलिश सिमेट्रिकल त्रिभुज
was formed on 01.05 at 01:34:53 (UTC+0)
signal strength 1 of 5
M5 के चार्ट के अनुसार, NZDUSD से बुलिश सिमेट्रिकल त्रिभुज पैटर्न बना। पैटर्न की निचली सीमा ने निर्देशांक 0.5921/0.5931 को स्पर्श किया जबकि ऊपरी सीमा 0.5941/0.5931 के पार गई। यदि
M5 और M15 समय सीमा में अधिक फाल्स एंट्री पॉइंट्स हो सकते हैं।
Open chart in a new window
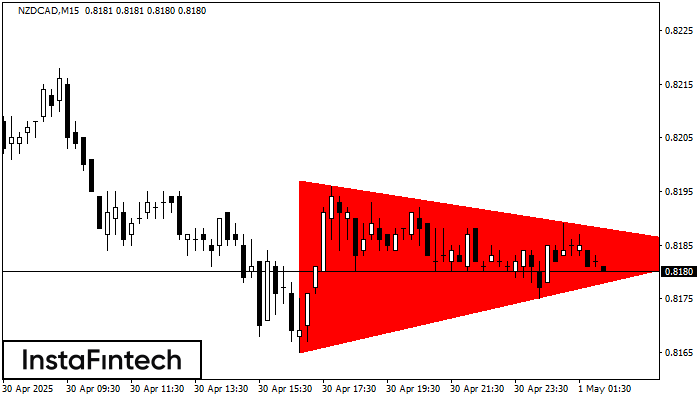
बियरिश सिमेट्रिकल त्रिभुज
was formed on 01.05 at 01:16:49 (UTC+0)
signal strength 2 of 5
M15 के चार्ट के अनुसार, NZDCAD से बियरिश सिमेट्रिकल त्रिभुज पैटर्न बना। विवरण: निचली सीमा 0.8165/0.8184 है और ऊपरी सीमा 0.8197/0.8184 है। पैटर्न की चौड़ाई चार्ट पर -32 पिप्स
M5 और M15 समय सीमा में अधिक फाल्स एंट्री पॉइंट्स हो सकते हैं।
Open chart in a new window
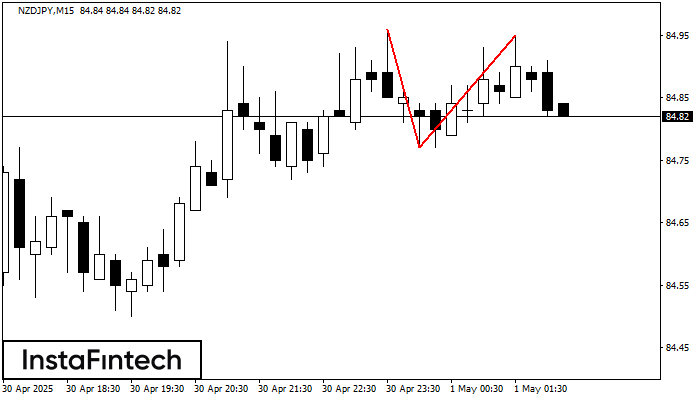
डबल टॉप
was formed on 01.05 at 01:15:25 (UTC+0)
signal strength 2 of 5
NZDJPY M15 के चार्ट पर डबल टॉप रीवर्सल पैटर्न बना है। विशेषताएं: ऊपरी सीमा 84.95; निचली सीमा 84.77; पैटर्न की चौड़ाई 18 पॉइंट्स। संकेत: निचली सीमा के टूटने से 84.54
M5 और M15 समय सीमा में अधिक फाल्स एंट्री पॉइंट्स हो सकते हैं।
Open chart in a new window


