यह भी देखें


 02.06.2022 12:24 PM
Hi, dear traders!
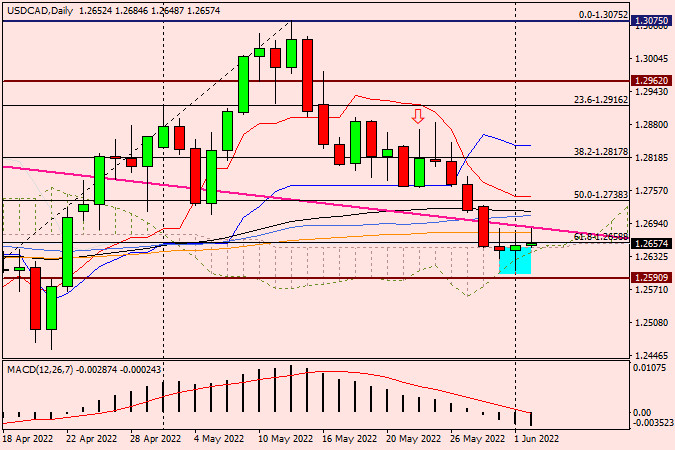
Yesterday, the Bank of Canada increased its key interest rate by 50 basis points to 1.50%, matching market expectations. However, some analysts expected a 75 basis point hike. In its release about the decision, the Bank of Canada stated it was not the last rate increase and that it was prepared to act more forcefully if needed. The regulator is determined to bring high inflation, which soared well above the target level during and after the pandemic, under control. "Canadian economic activity is strong, and the economy is clearly operating in excess demand," the central bank said. These economic conditions boost the Bank of Canada's resolve. The conflict in Ukraine pushed energy prices upwards, creating additional uncertainty and increasing inflationary risks. The Bank of Canada expects inflation to remain high and stated it would continue increasing interest rates. Despite the clearly hawkish tone of the Canadian central bank, the hike did not give support to the Canadian dollar, as market players have already priced in the rate move. USD/CAD reversed upwards from 1.2600 and recovered some of its losses, closing at 1.2652 and creating a candlestick with a long lower shadow on the daily chart. Similar to USD after the Federal Reserve's two rate hikes, CAD experienced bearish pressure.
Currently, USD/CAD is trading in a narrow range of 1.2606-1.2684. The pair's further trajectory remains unclear. Tomorrow's US labor market data could push USD/CAD out of the sideways trend, and the direction of this movement would likely determine the new trend. In this situation, there are good opportunities for both long and short positions. Short positions can be opened at 1.2675 and 1.2685. Long positions could be opened if the pair falls into the 1.2615-1.2600 zone. Traders should wait for appropriate candlestick signals before entering the market.
Good luck!
You have already liked this post today
*यहां पर लिखा गया बाजार विश्लेषण आपकी जागरूकता बढ़ाने के लिए किया है, लेकिन व्यापार करने के लिए निर्देश देने के लिए नहीं |
स्टोकास्टिक ऑस्सीलेटर इंडिकेटर और AUD/JPY की मूल्य आंदोलन में डाइवर्जेंस के दिखाई देने के साथ, और AUD/JPY का मूल्य WMA (30 शिफ्ट 2) के ऊपर स्थित है, जो कि
Your IP address shows that you are currently located in the USA. If you are a resident of the United States, you are prohibited from using the services of InstaFintech Group including online trading, online transfers, deposit/withdrawal of funds, etc.
If you think you are seeing this message by mistake and your location is not the US, kindly proceed to the website. Otherwise, you must leave the website in order to comply with government restrictions.
Why does your IP address show your location as the USA?
Please confirm whether you are a US resident or not by clicking the relevant button below. If you choose the wrong option, being a US resident, you will not be able to open an account with InstaTrade anyway.
We are sorry for any inconvenience caused by this message.

