यह भी देखें

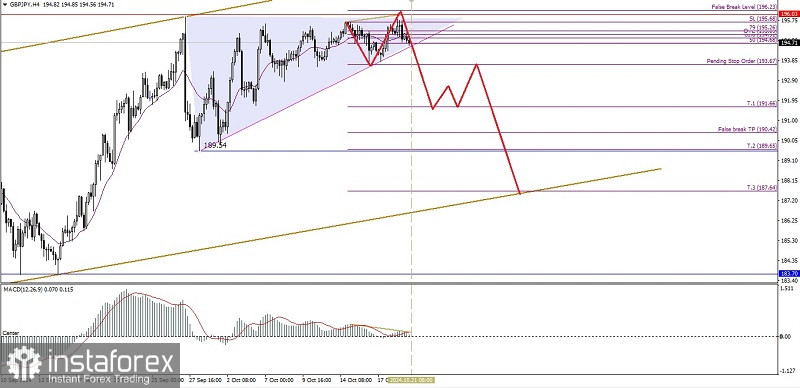
From what is seen on the 4-hour chart of the GBP/JPY cross currency pair, it appears that the price movement of the currency pair is in a Sideways condition where this is confirmed by the movement of its MA which is in the middle of its Candle body, but with the emergence of deviations between the GBP/JPY price movement and the MACD indicator, it gives an indication that in the near future GBP/JPY has the potential to weaken and fall where the level of 193.67 will be tested in the near future if there is no significant strengthening correction, especially until it breaks through and closes above the level of 196.03 and if GBP/JPY manages to break through and close below the level of 193.67, then GBP/JPY has the potential to continue its weakening to the level of 191.66 as its main target and 189.54 as the next target if momentum and volatility support it.
(Disclaimer)
You have already liked this post today
*यहां पर लिखा गया बाजार विश्लेषण आपकी जागरूकता बढ़ाने के लिए किया है, लेकिन व्यापार करने के लिए निर्देश देने के लिए नहीं |


