

Pola sebenarnya

Bullish Rectangle
was formed on 29.04 at 02:15:19 (UTC+0)
signal strength 2 of 5
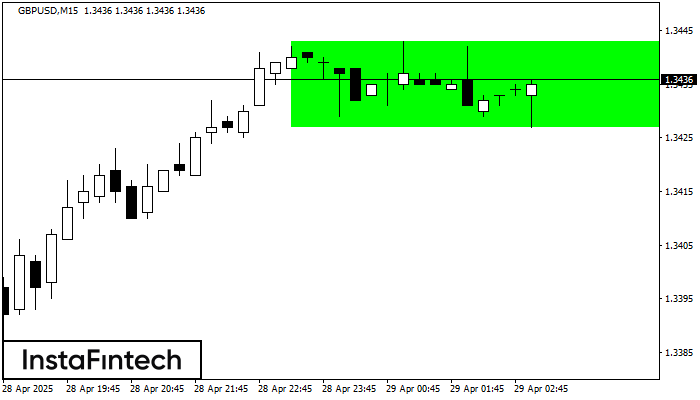
According to the chart of M15, GBPUSD formed the Bullish Rectangle which is a pattern of a trend continuation. The pattern is contained within the following borders: the lower border 1.3427 – 1.3427 and upper border 1.3443 – 1.3443. In case the upper border is broken, the instrument is likely to follow the upward trend.
The M5 and M15 time frames may have more false entry points.
Lihat juga
- All
- All
- Bearish Rectangle
- Bearish Symmetrical Triangle
- Bearish Symmetrical Triangle
- Bullish Rectangle
- Double Top
- Double Top
- Triple Bottom
- Triple Bottom
- Triple Top
- Triple Top
- All
- All
- Buy
- Sale
- All
- 1
- 2
- 3
- 4
- 5
Teratas Triple
was formed on 20.06 at 01:05:22 (UTC+0)
signal strength 1 of 5
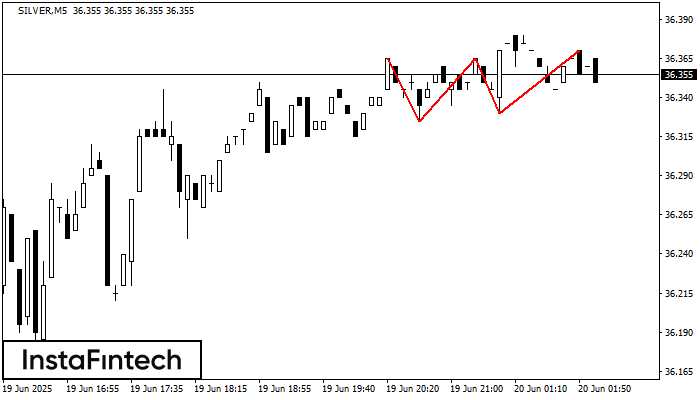
Pola Teratas Triple telah terbentuk pada grafik instrumen trading SILVER M5. Pola tersebut merupakan pola reversal menampilkan karakteristik berikut: level resistance -5, levek support -5, dan lebar pola 40. Prakiraan
Rangka waktu M5 dan M15 mungkin memiliki lebih dari titik entri yang keliru.
Open chart in a new window
Bawah Ganda
was formed on 20.06 at 01:00:14 (UTC+0)
signal strength 4 of 5
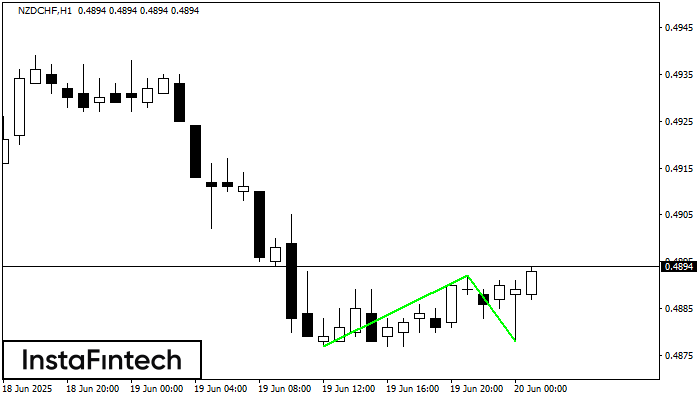
Pola Bawah Ganda telah terbentuk pada NZDCHF H1. Karakteristik: level support 0.4877; level resistance 0.4892; lebar pola 15 poin. Jika level resistance ditembus, perubahan dalam tren dapat diprediksi dengan target
Open chart in a new window
Kepala dan bahu
was formed on 20.06 at 00:30:27 (UTC+0)
signal strength 3 of 5
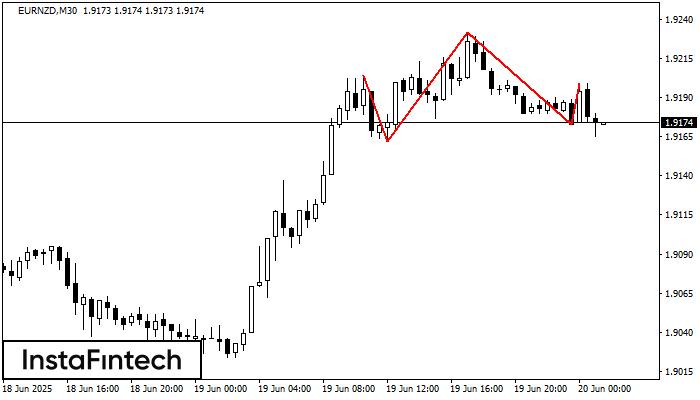
Pola teknikal yang disebut Kepala dan bahu telah muncul pada grafik EURNZD M30. Terdapat banyak alasan untuk harga melewati Neckline 1.9162/1.9173 setelah Shoulder kanan terbentuk. Jadi, tren akan berubah dengan
Open chart in a new window


