

Pola sebenarnya

Bullish Rectangle
was formed on 29.04 at 01:45:09 (UTC+0)
signal strength 1 of 5
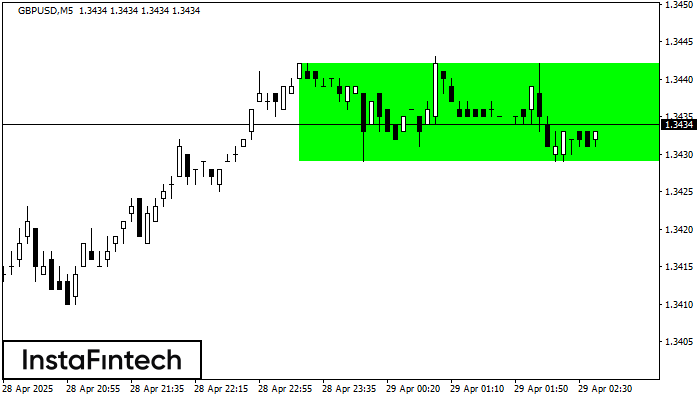
According to the chart of M5, GBPUSD formed the Bullish Rectangle which is a pattern of a trend continuation. The pattern is contained within the following borders: the lower border 1.3429 – 1.3429 and upper border 1.3442 – 1.3442. In case the upper border is broken, the instrument is likely to follow the upward trend.
The M5 and M15 time frames may have more false entry points.
Lihat juga
- All
- All
- Bearish Rectangle
- Bearish Symmetrical Triangle
- Bearish Symmetrical Triangle
- Bullish Rectangle
- Double Top
- Double Top
- Triple Bottom
- Triple Bottom
- Triple Top
- Triple Top
- All
- All
- Buy
- Sale
- All
- 1
- 2
- 3
- 4
- 5
Teratas Ganda
was formed on 07.06 at 11:00:16 (UTC+0)
signal strength 3 of 5

Pola reversal Teratas Ganda telah terbentuk pada #Bitcoin M30. Karakteristik: batas atas 105283.16; batas bawah 103816.55; lebar pola 147353 poin. Transaksi jual lebih baik dibuka di bawah batas bawah 103816.55
Open chart in a new window
Teratas Ganda
was formed on 06.06 at 22:30:10 (UTC+0)
signal strength 2 of 5

Pada grafik USDCAD M15 pola reversal Teratas Ganda telah terbentuk. Karakteristik: batas atas 1.3702; batas bawah 1.3668; lebar pola 34 poin. Sinyal: tembusan ke batas bawah akan menyebabkan kelanjutan tren
Rangka waktu M5 dan M15 mungkin memiliki lebih dari titik entri yang keliru.
Open chart in a new window
Segitiga Simetris Bullish
was formed on 06.06 at 22:18:11 (UTC+0)
signal strength 2 of 5

Menurut Grafik dari M15, AUDJPY dibentuk pola Segitiga Simetris Bullish. Batas yang lebih rendah dari pola menyentuh kordinat 93.96/94.02 dimana batas atas berada sepanjang 94.07/94.02. Jika pola Segitiga Simetris Bullish
Rangka waktu M5 dan M15 mungkin memiliki lebih dari titik entri yang keliru.
Open chart in a new window


