

Pola sebenarnya

Triple Top
was formed on 18.04 at 18:00:33 (UTC+0)
signal strength 3 of 5
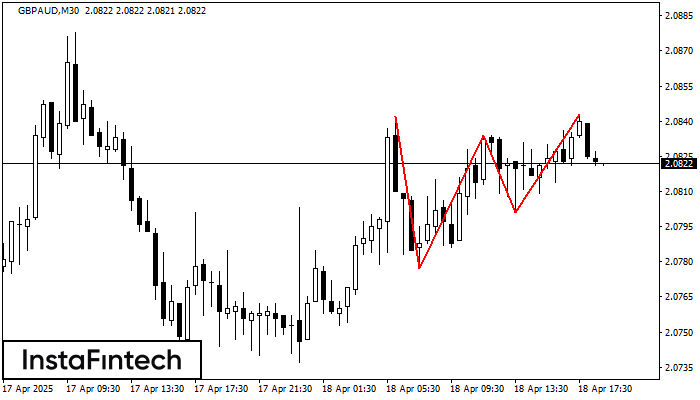
The Triple Top pattern has formed on the chart of the GBPAUD M30. Features of the pattern: borders have an ascending angle; the lower line of the pattern has the coordinates 2.0777/2.0801 with the upper limit 2.0842/2.0843; the projection of the width is 65 points. The formation of the Triple Top figure most likely indicates a change in the trend from upward to downward. This means that in the event of a breakdown of the support level of 2.0777, the price is most likely to continue the downward movement.
Lihat juga
- All
- All
- Bearish Rectangle
- Bearish Symmetrical Triangle
- Bearish Symmetrical Triangle
- Bullish Rectangle
- Double Top
- Double Top
- Triple Bottom
- Triple Bottom
- Triple Top
- Triple Top
- All
- All
- Buy
- Sale
- All
- 1
- 2
- 3
- 4
- 5
Persegi Bearish
was formed on 02.06 at 12:19:58 (UTC+0)
signal strength 1 of 5
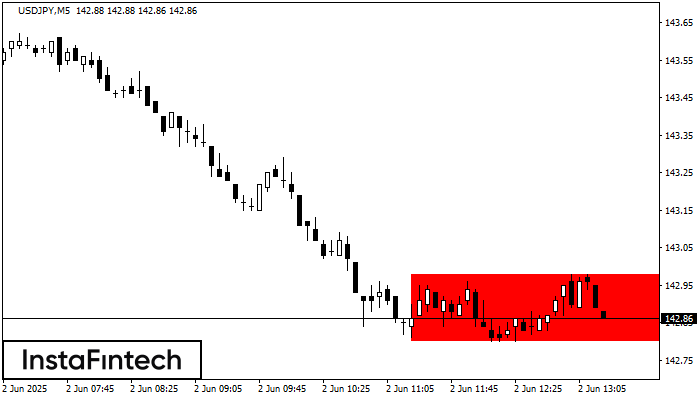
Menurut grafik dari M5, USDJPY terbentuk Persegi Bearish yang merupakan pola dari kelanjutan tren. Pola terkandung di dalam batas berikut: batas lebih rendah 142.80 – 142.80 dan batas atas 142.98
Rangka waktu M5 dan M15 mungkin memiliki lebih dari titik entri yang keliru.
Open chart in a new window
Teratas Ganda
was formed on 02.06 at 12:15:32 (UTC+0)
signal strength 2 of 5
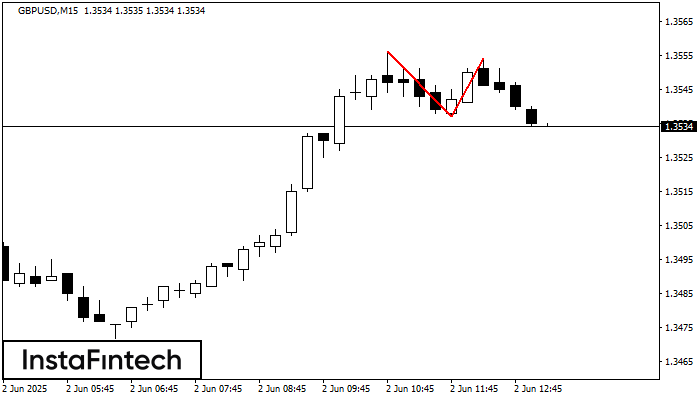
Pola reversal Teratas Ganda telah terbentuk pada GBPUSD M15. Karakteristik: batas atas 1.3556; batas bawah 1.3537; lebar pola 17 poin. Transaksi jual lebih baik dibuka di bawah batas bawah 1.3537
Rangka waktu M5 dan M15 mungkin memiliki lebih dari titik entri yang keliru.
Open chart in a new window
Teratas Ganda
was formed on 02.06 at 12:14:45 (UTC+0)
signal strength 2 of 5
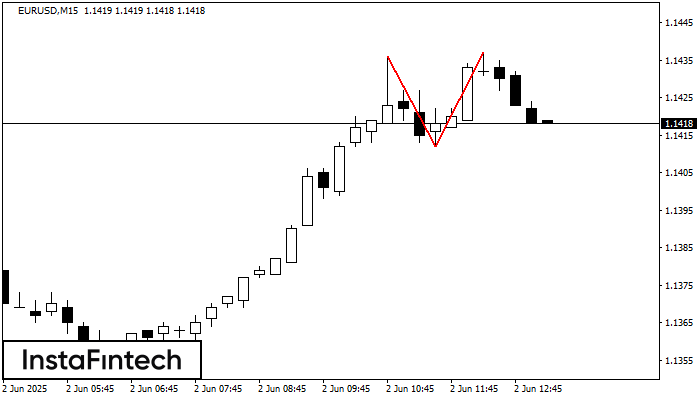
Pola Teratas Ganda telah terbentuk pada EURUSD M15. Pola ini menandakan bahwa tren telah berubah dari kenaikan menjadi penurunan. Mungkin, jika dasar pola di 1.1412 ditembus, maka pergerakan menurun akan
Rangka waktu M5 dan M15 mungkin memiliki lebih dari titik entri yang keliru.
Open chart in a new window


