

Pola sebenarnya

Double Bottom
was formed on 18.04 at 03:05:35 (UTC+0)
signal strength 1 of 5
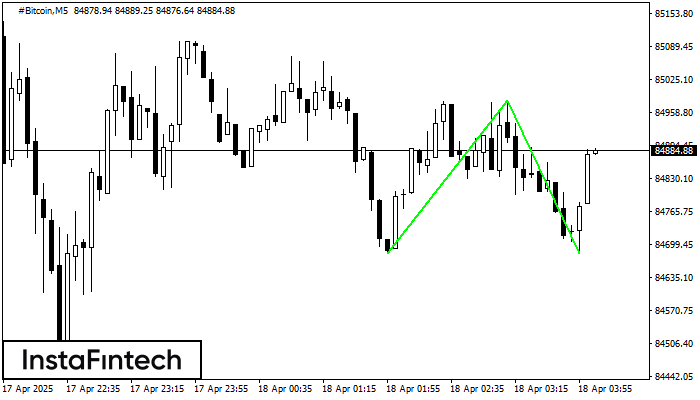
The Double Bottom pattern has been formed on #Bitcoin M5. Characteristics: the support level 84682.60; the resistance level 84984.00; the width of the pattern 30140 points. If the resistance level is broken, a change in the trend can be predicted with the first target point lying at the distance of 30098 points.
The M5 and M15 time frames may have more false entry points.
Lihat juga
- All
- All
- Bearish Rectangle
- Bearish Symmetrical Triangle
- Bearish Symmetrical Triangle
- Bullish Rectangle
- Double Top
- Double Top
- Triple Bottom
- Triple Bottom
- Triple Top
- Triple Top
- All
- All
- Buy
- Sale
- All
- 1
- 2
- 3
- 4
- 5
Double Bottom
сформирован 10.06 в 12:00:33 (UTC+0)
сила сигнала 2 из 5
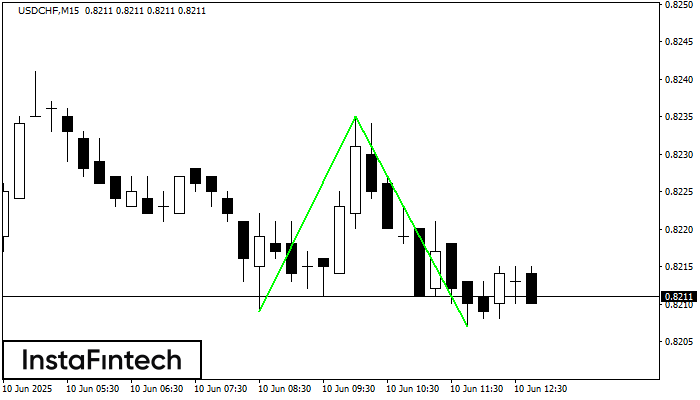
The Double Bottom pattern has been formed on USDCHF M15; the upper boundary is 0.8235; the lower boundary is 0.8207. The width of the pattern is 26 points. In case
The M5 and M15 time frames may have more false entry points.
Открыть график инструмента в новом окне
Triple Bottom
сформирован 10.06 в 11:40:23 (UTC+0)
сила сигнала 1 из 5
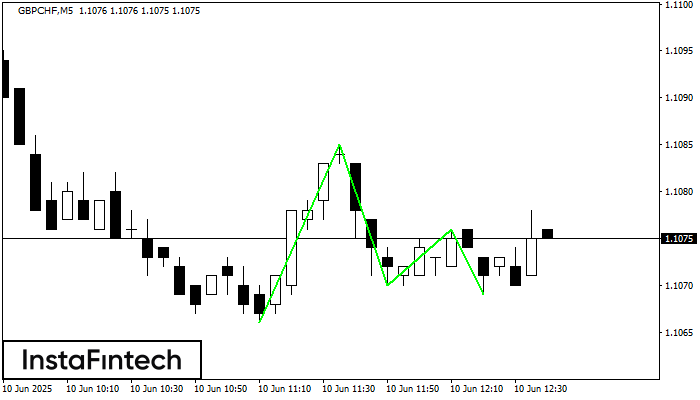
The Triple Bottom pattern has formed on the chart of the GBPCHF M5 trading instrument. The pattern signals a change in the trend from downwards to upwards in the case
The M5 and M15 time frames may have more false entry points.
Открыть график инструмента в новом окне
Double Top
сформирован 10.06 в 11:31:01 (UTC+0)
сила сигнала 1 из 5
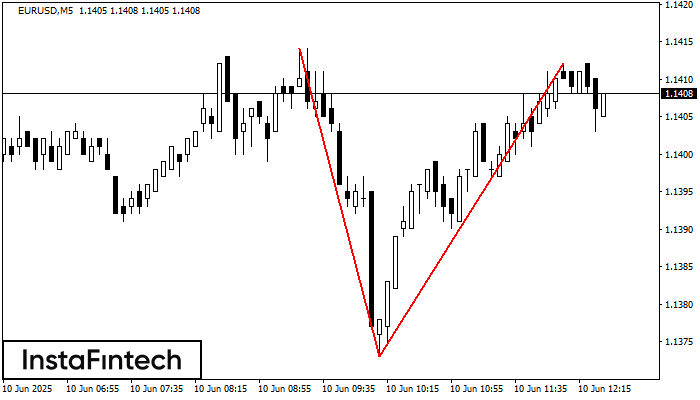
On the chart of EURUSD M5 the Double Top reversal pattern has been formed. Characteristics: the upper boundary 1.1412; the lower boundary 1.1373; the width of the pattern 39 points
The M5 and M15 time frames may have more false entry points.
Открыть график инструмента в новом окне


