

Pola sebenarnya

Bearish Flag
was formed on 14.04 at 20:47:04 (UTC+0)
signal strength 3 of 5

The Bearish Flag pattern has been formed on EURJPY at M30. The lower boundary of the pattern is located at 162.05/162.27 while the upper boundary lies at 162.33/162.55. The projection of the flagpole is 88 points. This formation signals that the downward trend is most likely to continue. Therefore, if the level of 162.05 is broken, the price will move further downwards.
Lihat juga
- All
- All
- Bearish Rectangle
- Bearish Symmetrical Triangle
- Bearish Symmetrical Triangle
- Bullish Rectangle
- Double Top
- Double Top
- Triple Bottom
- Triple Bottom
- Triple Top
- Triple Top
- All
- All
- Buy
- Sale
- All
- 1
- 2
- 3
- 4
- 5
Bawah Ganda
was formed on 30.04 at 20:00:54 (UTC+0)
signal strength 2 of 5
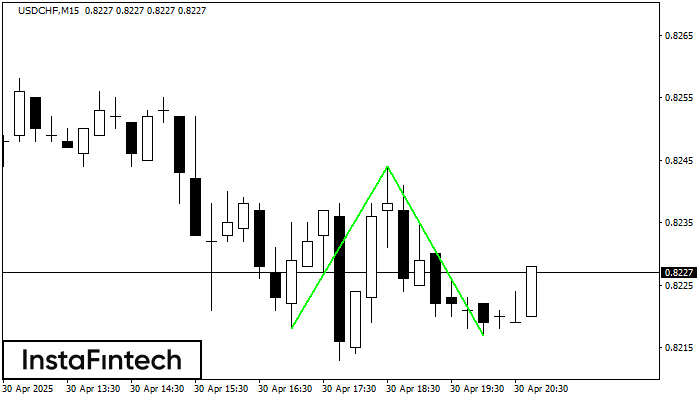
Pola Bawah Ganda telah terbentuk pada USDCHF M15; batas atas di 0.8244; batas bawah di 0.8217. Lebar pola sebesar 26 poin. Jika harga menembus batas atas 0.8244, Perubahan dalam tren
Rangka waktu M5 dan M15 mungkin memiliki lebih dari titik entri yang keliru.
Open chart in a new window
Bendera Bullish
was formed on 30.04 at 19:53:06 (UTC+0)
signal strength 1 of 5
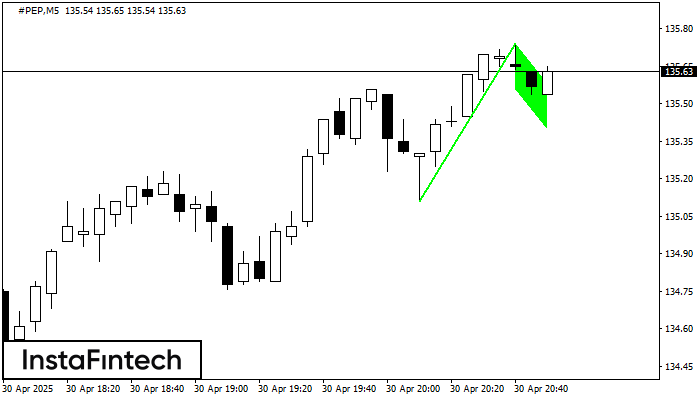
Pola Bendera Bullish telah terbentuk di #PEP at M5. Batas bawah pola ini terletak di 135.56/135.40, sementara batas atas terletak di 135.74/135.58. Proyeksi panjang jarum candle 63 poin. Pembentukan
Rangka waktu M5 dan M15 mungkin memiliki lebih dari titik entri yang keliru.
Open chart in a new window
Bendera Bullish
was formed on 30.04 at 19:53:05 (UTC+0)
signal strength 1 of 5

Pola Bendera Bullish yang memberikan sinyal kelanjutan tren telah terbentuk di grafik #PEP M5. Prakiraan: jika harga menembus ke atas titik tertinggi harga di 135.74, maka para trader akan dapat
Rangka waktu M5 dan M15 mungkin memiliki lebih dari titik entri yang keliru.
Open chart in a new window


