

Pola sebenarnya

Triple Bottom
was formed on 11.04 at 21:00:25 (UTC+0)
signal strength 1 of 5
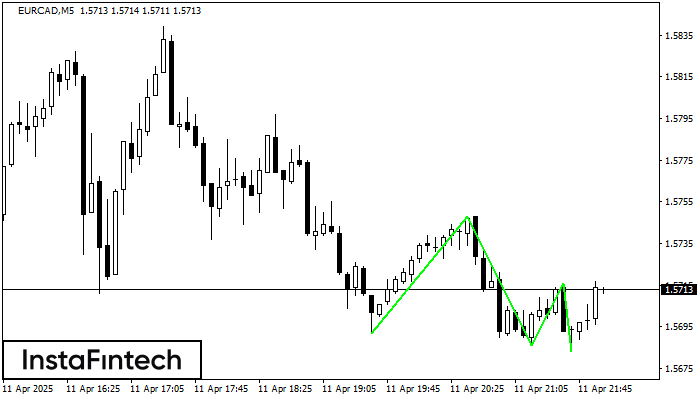
The Triple Bottom pattern has formed on the chart of EURCAD M5. Features of the pattern: The lower line of the pattern has coordinates 1.5748 with the upper limit 1.5748/1.5716, the projection of the width is 56 points. The formation of the Triple Bottom pattern most likely indicates a change in the trend from downward to upward. This means that in the event of a breakdown of the resistance level 1.5692, the price is most likely to continue the upward movement.
The M5 and M15 time frames may have more false entry points.
- All
- All
- Bearish Rectangle
- Bearish Symmetrical Triangle
- Bearish Symmetrical Triangle
- Bullish Rectangle
- Double Top
- Double Top
- Triple Bottom
- Triple Bottom
- Triple Top
- Triple Top
- All
- All
- Buy
- Sale
- All
- 1
- 2
- 3
- 4
- 5
Teratas Ganda
was formed on 03.06 at 11:31:25 (UTC+0)
signal strength 3 of 5
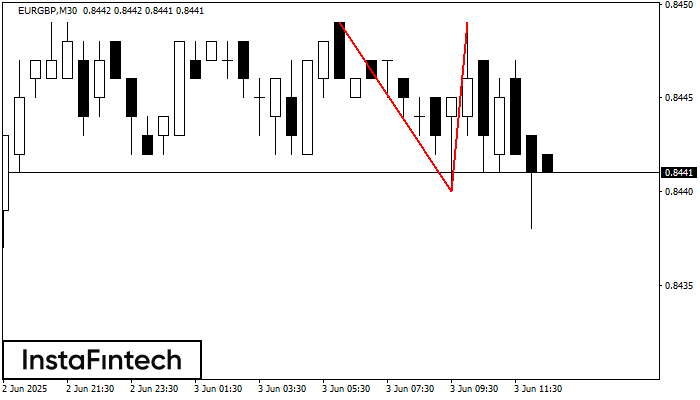
Pada grafik EURGBP M30 pola reversal Teratas Ganda telah terbentuk. Karakteristik: batas atas 0.8449; batas bawah 0.8440; lebar pola 9 poin. Sinyal: tembusan ke batas bawah akan menyebabkan kelanjutan tren
Open chart in a new window
Segitiga Simetris Bearish
was formed on 03.06 at 11:00:10 (UTC+0)
signal strength 1 of 5
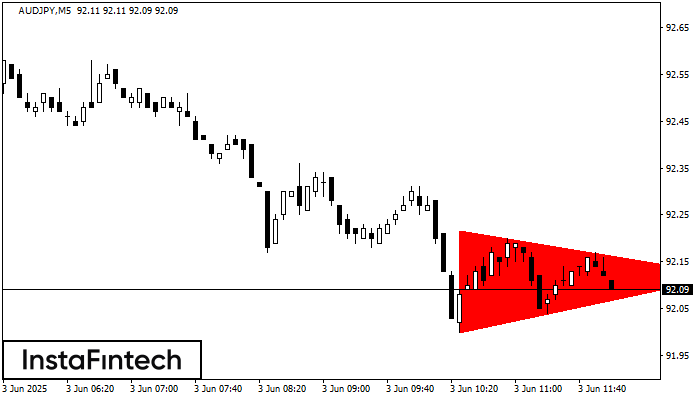
Menurut Grafik dari M5, AUDJPY dibentuk pola Segitiga Simetris Bearish. Rekomendasi Trading: Penembusan dari batas yang lebih rendah 92.00 kemungkinan akan mendorong kelanjutan dari tren penurunan
Rangka waktu M5 dan M15 mungkin memiliki lebih dari titik entri yang keliru.
Open chart in a new window
Teratas Ganda
was formed on 03.06 at 10:46:27 (UTC+0)
signal strength 2 of 5
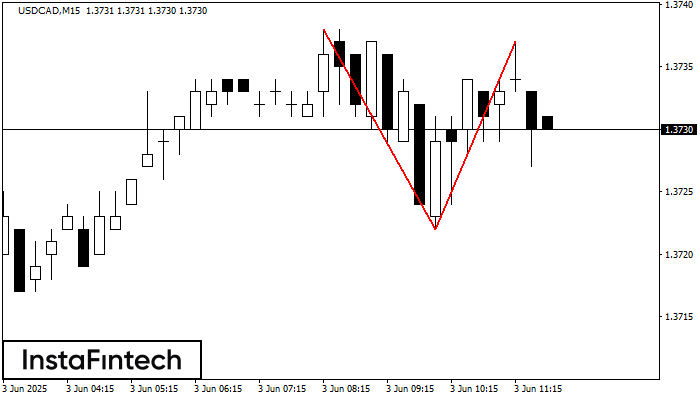
Pola reversal Teratas Ganda telah terbentuk pada USDCAD M15. Karakteristik: batas atas 1.3738; batas bawah 1.3722; lebar pola 15 poin. Transaksi jual lebih baik dibuka di bawah batas bawah 1.3722
Rangka waktu M5 dan M15 mungkin memiliki lebih dari titik entri yang keliru.
Open chart in a new window


