

Pola sebenarnya

Double Bottom
was formed on 11.04 at 20:00:26 (UTC+0)
signal strength 4 of 5
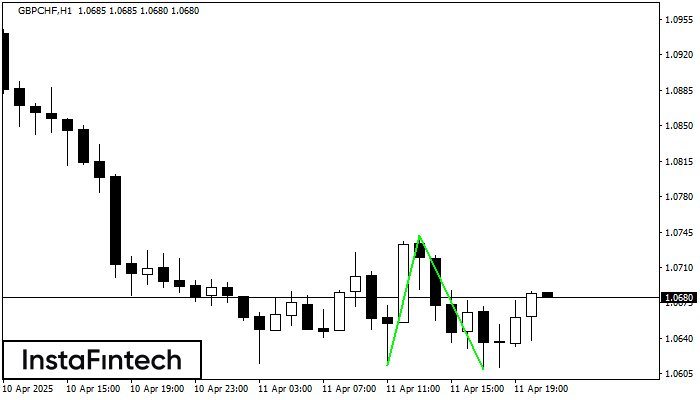
The Double Bottom pattern has been formed on GBPCHF H1. Characteristics: the support level 1.0613; the resistance level 1.0742; the width of the pattern 129 points. If the resistance level is broken, a change in the trend can be predicted with the first target point lying at the distance of 133 points.
- All
- All
- Bearish Rectangle
- Bearish Symmetrical Triangle
- Bearish Symmetrical Triangle
- Bullish Rectangle
- Double Top
- Double Top
- Triple Bottom
- Triple Bottom
- Triple Top
- Triple Top
- All
- All
- Buy
- Sale
- All
- 1
- 2
- 3
- 4
- 5
Teratas Ganda
was formed on 03.06 at 12:45:53 (UTC+0)
signal strength 1 of 5
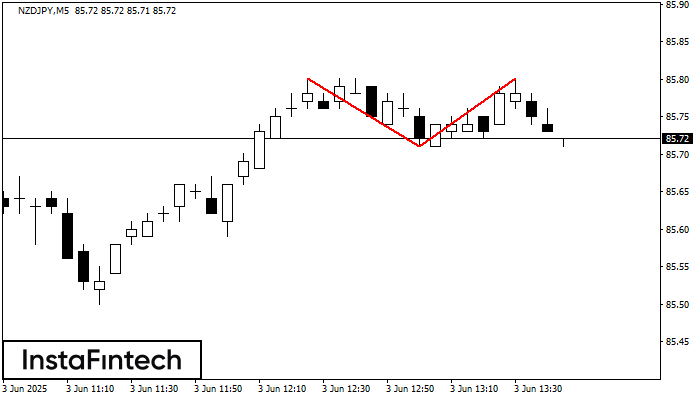
Pada grafik NZDJPY M5 pola reversal Teratas Ganda telah terbentuk. Karakteristik: batas atas 85.80; batas bawah 85.71; lebar pola 9 poin. Sinyal: tembusan ke batas bawah akan menyebabkan kelanjutan tren
Rangka waktu M5 dan M15 mungkin memiliki lebih dari titik entri yang keliru.
Open chart in a new window
Bawah Ganda
was formed on 03.06 at 12:05:32 (UTC+0)
signal strength 1 of 5
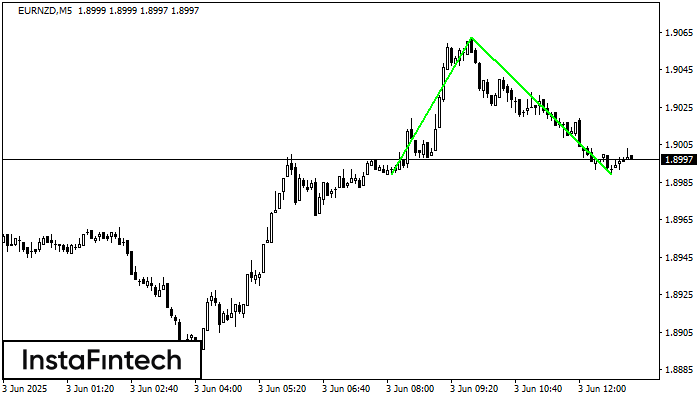
Pola Bawah Ganda telah terbentuk pada EURNZD M5; batas atas di 1.9062; batas bawah di 1.8989. Lebar pola sebesar 73 poin. Jika harga menembus batas atas 1.9062, Perubahan dalam tren
Rangka waktu M5 dan M15 mungkin memiliki lebih dari titik entri yang keliru.
Open chart in a new window
Teratas Ganda
was formed on 03.06 at 12:01:19 (UTC+0)
signal strength 3 of 5
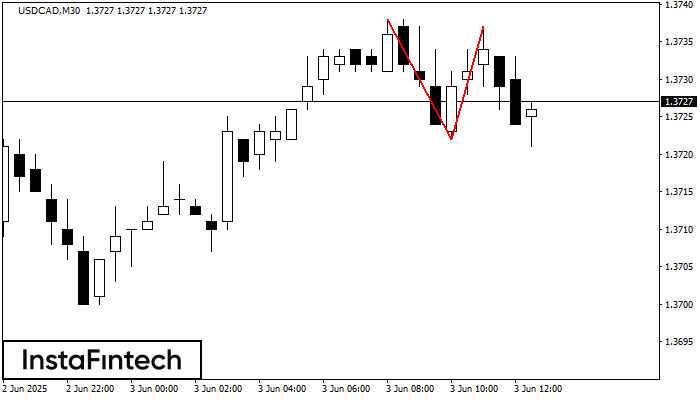
Pola Teratas Ganda telah terbentuk pada USDCAD M30. Pola ini menandakan bahwa tren telah berubah dari kenaikan menjadi penurunan. Mungkin, jika dasar pola di 1.3722 ditembus, maka pergerakan menurun akan
Open chart in a new window


