

Pola sebenarnya

Double Bottom
was formed on 11.04 at 19:00:41 (UTC+0)
signal strength 3 of 5
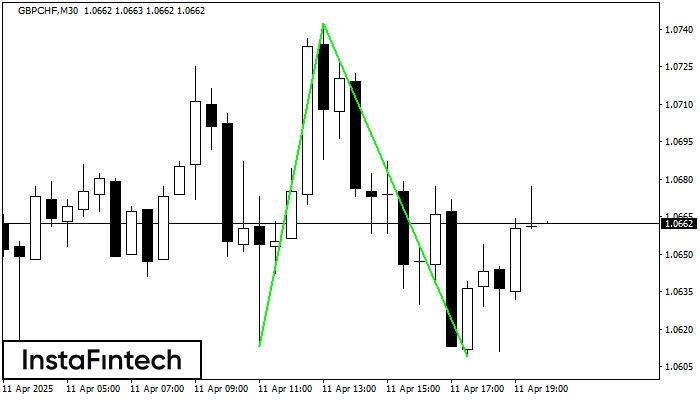
The Double Bottom pattern has been formed on GBPCHF M30. This formation signals a reversal of the trend from downwards to upwards. The signal is that a buy trade should be opened after the upper boundary of the pattern 1.0742 is broken. The further movements will rely on the width of the current pattern 129 points.
Lihat juga
- All
- All
- Bearish Rectangle
- Bearish Symmetrical Triangle
- Bearish Symmetrical Triangle
- Bullish Rectangle
- Double Top
- Double Top
- Triple Bottom
- Triple Bottom
- Triple Top
- Triple Top
- All
- All
- Buy
- Sale
- All
- 1
- 2
- 3
- 4
- 5
Bullish Symmetrical Triangle
сформирован 01.05 в 03:55:25 (UTC+0)
сила сигнала 2 из 5
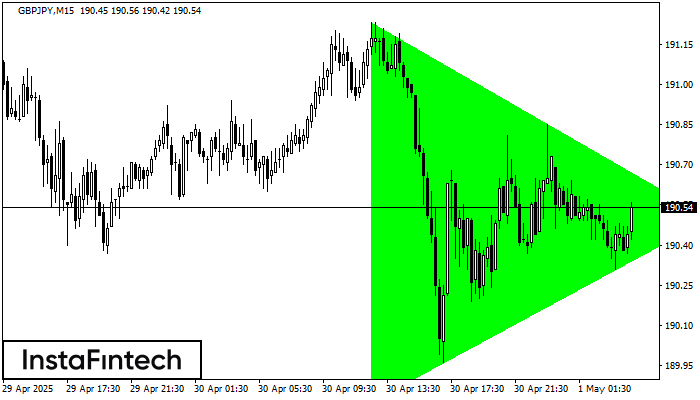
According to the chart of M15, GBPJPY formed the Bullish Symmetrical Triangle pattern, which signals the trend will continue. Description. The upper border of the pattern touches the coordinates 191.23/190.50
The M5 and M15 time frames may have more false entry points.
Открыть график инструмента в новом окне
Double Top
сформирован 01.05 в 02:45:07 (UTC+0)
сила сигнала 2 из 5
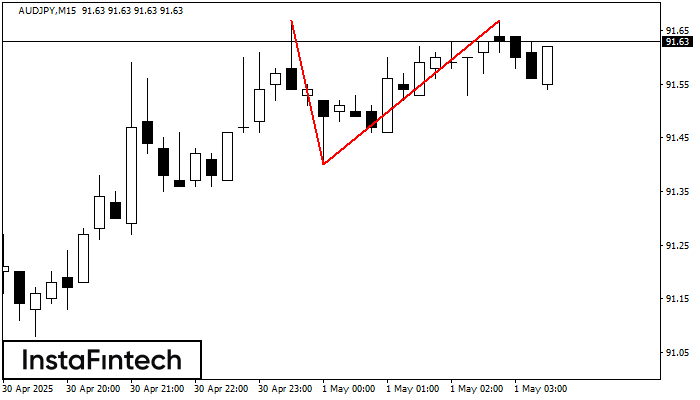
The Double Top reversal pattern has been formed on AUDJPY M15. Characteristics: the upper boundary 91.67; the lower boundary 91.40; the width of the pattern is 27 points. Sell trades
The M5 and M15 time frames may have more false entry points.
Открыть график инструмента в новом окне
Double Bottom
сформирован 01.05 в 02:30:22 (UTC+0)
сила сигнала 1 из 5
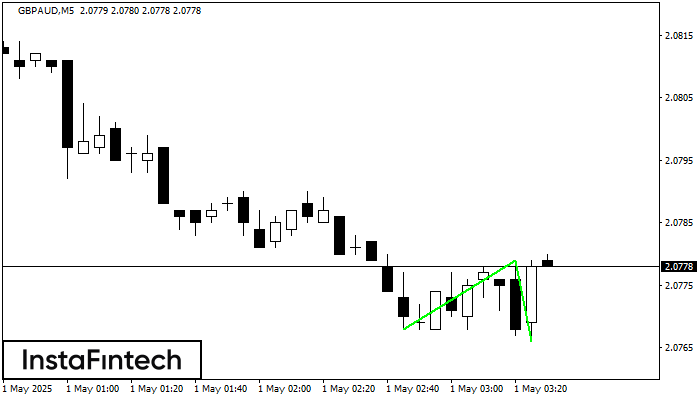
The Double Bottom pattern has been formed on GBPAUD M5. This formation signals a reversal of the trend from downwards to upwards. The signal is that a buy trade should
The M5 and M15 time frames may have more false entry points.
Открыть график инструмента в новом окне


