

Pola sebenarnya

Double Bottom
was formed on 11.04 at 11:59:58 (UTC+0)
signal strength 3 of 5
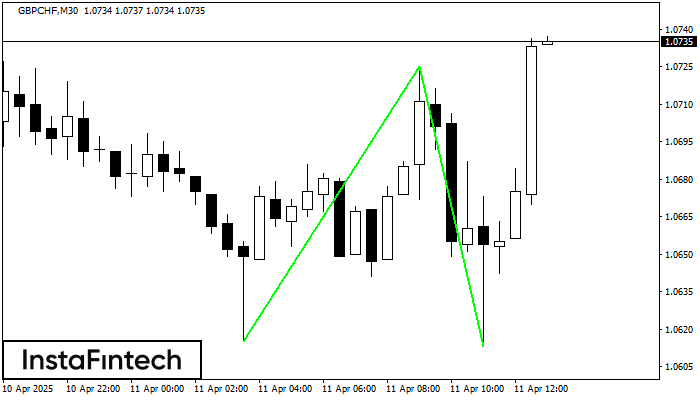
The Double Bottom pattern has been formed on GBPCHF M30; the upper boundary is 1.0725; the lower boundary is 1.0613. The width of the pattern is 110 points. In case of a break of the upper boundary 1.0725, a change in the trend can be predicted where the width of the pattern will coincide with the distance to a possible take profit level.
- All
- All
- Bearish Rectangle
- Bearish Symmetrical Triangle
- Bearish Symmetrical Triangle
- Bullish Rectangle
- Double Top
- Double Top
- Triple Bottom
- Triple Bottom
- Triple Top
- Triple Top
- All
- All
- Buy
- Sale
- All
- 1
- 2
- 3
- 4
- 5
Panji Bearish
was formed on 02.06 at 09:40:38 (UTC+0)
signal strength 1 of 5
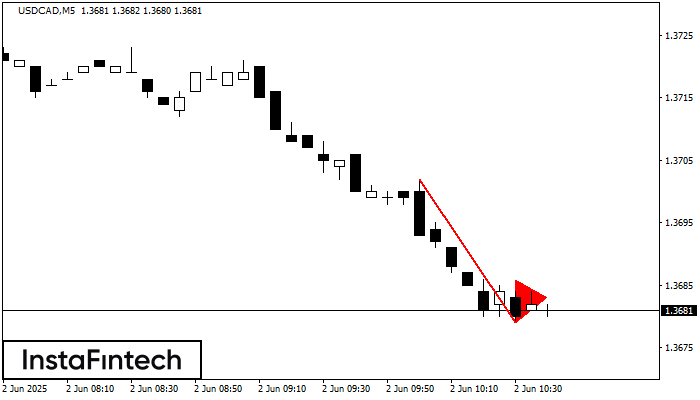
Pola Panji Bearish telah terbentuk di grafik USDCAD M5. Pola ini memberikan sinyal potensi kelanjutan tren yang ada. Spesifikasi: titik terendah pola berkoordinat di 1.3679; proyeksi titik tertinggi sama dengan
Rangka waktu M5 dan M15 mungkin memiliki lebih dari titik entri yang keliru.
Open chart in a new window
Segitiga Simetris Bullish
was formed on 02.06 at 09:22:12 (UTC+0)
signal strength 4 of 5

Menurut Grafik dari H1, EURJPY dibentuk pola Segitiga Simetris Bullish. Batas yang lebih rendah dari pola menyentuh kordinat 162.28/163.37 dimana batas atas berada sepanjang 164.23/163.37. Jika pola Segitiga Simetris Bullish
Open chart in a new window
Bawah Ganda
was formed on 02.06 at 09:00:13 (UTC+0)
signal strength 3 of 5

Pola Bawah Ganda telah terbentuk pada GBPJPY M30. Karakteristik: level support 193.37; level resistance 194.63; lebar pola 126 poin. Jika level resistance ditembus, perubahan dalam tren dapat diprediksi dengan target
Open chart in a new window


