

Pola sebenarnya

Triple Top
was formed on 08.04 at 04:25:10 (UTC+0)
signal strength 1 of 5
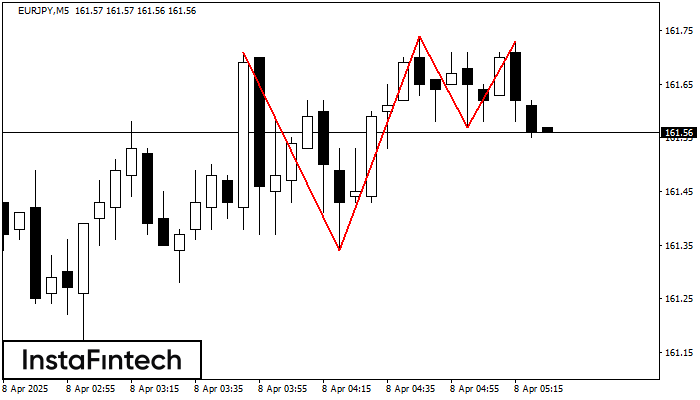
On the chart of the EURJPY M5 trading instrument, the Triple Top pattern that signals a trend change has formed. It is possible that after formation of the third peak, the price will try to break through the resistance level 161.34, where we advise to open a trading position for sale. Take profit is the projection of the pattern’s width, which is 37 points.
The M5 and M15 time frames may have more false entry points.
Lihat juga
- All
- All
- Bearish Rectangle
- Bearish Symmetrical Triangle
- Bearish Symmetrical Triangle
- Bullish Rectangle
- Double Top
- Double Top
- Triple Bottom
- Triple Bottom
- Triple Top
- Triple Top
- All
- All
- Buy
- Sale
- All
- 1
- 2
- 3
- 4
- 5
Segitiga Simetris Bullish
was formed on 02.05 at 05:03:31 (UTC+0)
signal strength 1 of 5
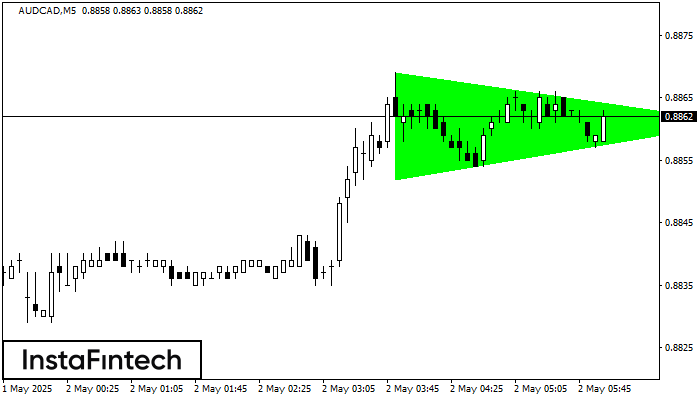
Menurut Grafik dari M5, AUDCAD dibentuk pola Segitiga Simetris Bullish. Batas yang lebih rendah dari pola menyentuh kordinat 0.8852/0.8861 dimana batas atas berada sepanjang 0.8869/0.8861. Jika pola Segitiga Simetris Bullish
Rangka waktu M5 dan M15 mungkin memiliki lebih dari titik entri yang keliru.
Open chart in a new window
Bawah Ganda
was formed on 02.05 at 04:35:10 (UTC+0)
signal strength 1 of 5
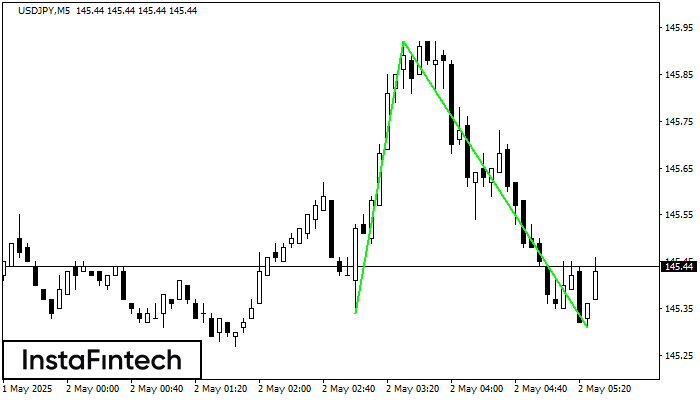
Pola Bawah Ganda telah terbentuk pada USDJPY M5. Formasi ini mensinyalkan reversal tren dari arah penurunan ke arah kenaikan. Sinyal menunjukkan bahwa transaksi beli harus dibuka setelah batas atas pola
Rangka waktu M5 dan M15 mungkin memiliki lebih dari titik entri yang keliru.
Open chart in a new window
Segitiga Simetris Bearish
was formed on 02.05 at 03:46:47 (UTC+0)
signal strength 1 of 5
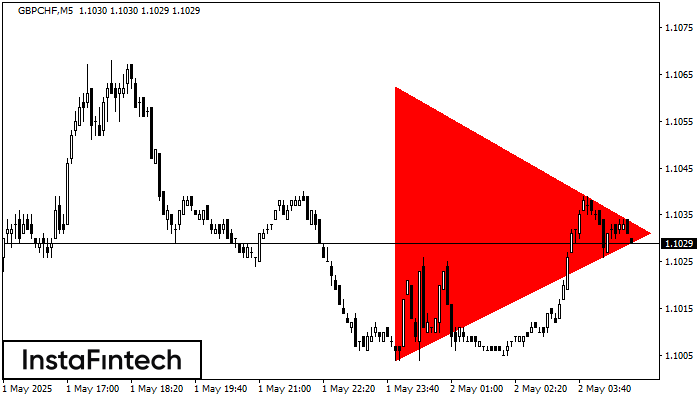
Menurut Grafik dari M5, GBPCHF dibentuk pola Segitiga Simetris Bearish. Deskripsi: Batas yang lebih rendah adalah 1.1004/1.1031 dan batas atas adalah 1.1063/1.1031. Lebar pola diukur dalam grafik di -59 pips
Rangka waktu M5 dan M15 mungkin memiliki lebih dari titik entri yang keliru.
Open chart in a new window


