

Pola sebenarnya

Bullish Symmetrical Triangle
was formed on 07.04 at 06:30:04 (UTC+0)
signal strength 3 of 5

According to the chart of M30, EURCAD formed the Bullish Symmetrical Triangle pattern. The lower border of the pattern touches the coordinates 1.5415/1.5608 whereas the upper border goes across 1.5743/1.5608. If the Bullish Symmetrical Triangle pattern is in progress, this evidently signals a further upward trend. In other words, in case the scenario comes true, the price of EURCAD will breach the upper border to head for 1.5638.
Lihat juga
- All
- All
- Bearish Rectangle
- Bearish Symmetrical Triangle
- Bearish Symmetrical Triangle
- Bullish Rectangle
- Double Top
- Double Top
- Triple Bottom
- Triple Bottom
- Triple Top
- Triple Top
- All
- All
- Buy
- Sale
- All
- 1
- 2
- 3
- 4
- 5
Persegi Bullish
was formed on 02.06 at 22:15:32 (UTC+0)
signal strength 4 of 5
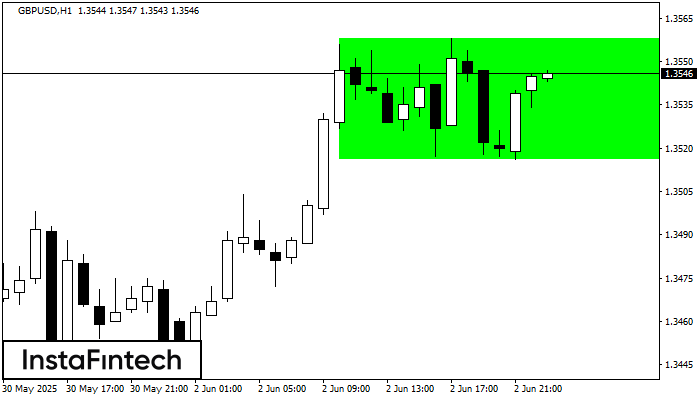
Menurut grafik dari H1, GBPUSD terbentuk Persegi Bullish. Jenis pola ini menunjukkan kelanjutan tren. Terdiri dari dua tingkat: resistance 1.3558 dan support 1.3516. Jika level resistance 1.3558 - 1.3558 ditembus
Open chart in a new window
Segitiga Simetris Bullish
was formed on 02.06 at 22:06:22 (UTC+0)
signal strength 1 of 5
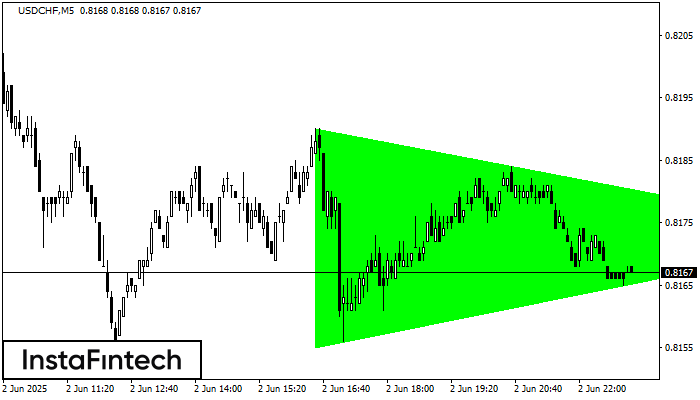
Menurut Grafik dari M5, USDCHF dibentuk pola Segitiga Simetris Bullish, yang menunjukkan tren akan berlanjut. Deksripsi. Batas atas dari pola menyentuh kordinat 0.8190/0.8173 dimana batas yang lebih rendah berada sepanjang
Rangka waktu M5 dan M15 mungkin memiliki lebih dari titik entri yang keliru.
Open chart in a new window
Segitiga Simetris Bearish
was formed on 02.06 at 21:58:20 (UTC+0)
signal strength 1 of 5
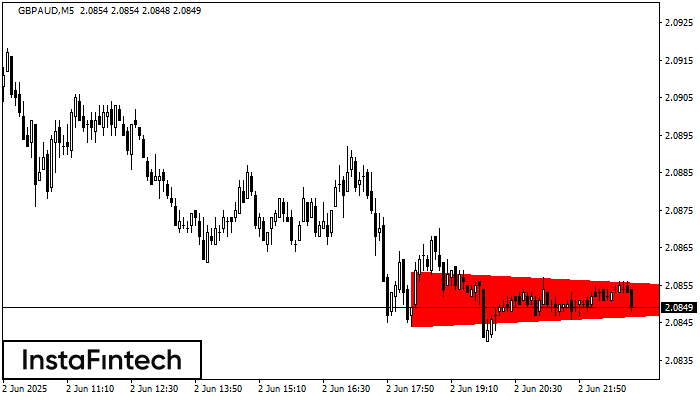
Menurut Grafik dari M5, GBPAUD dibentuk pola Segitiga Simetris Bearish. Deskripsi: Batas yang lebih rendah adalah 2.0844/2.0851 dan batas atas adalah 2.0859/2.0851. Lebar pola diukur dalam grafik di -15 pips
Rangka waktu M5 dan M15 mungkin memiliki lebih dari titik entri yang keliru.
Open chart in a new window


