

Pola sebenarnya

Bearish Rectangle
was formed on 06.04 at 23:00:32 (UTC+0)
signal strength 3 of 5
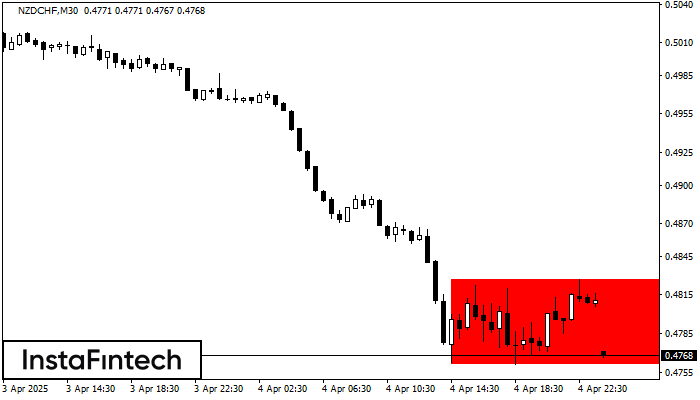
According to the chart of M30, NZDCHF formed the Bearish Rectangle. The pattern indicates a trend continuation. The upper border is 0.4827, the lower border is 0.4761. The signal means that a short position should be opened after fixing a price below the lower border 0.4761 of the Bearish Rectangle.
Figure
- All
Instrument
- All
- Bearish Rectangle
- Bearish Symmetrical Triangle
- Bearish Symmetrical Triangle
- Bullish Rectangle
- Double Top
- Double Top
- Triple Bottom
- Triple Bottom
- Triple Top
- Triple Top
Timeframe
- All
Trend
- All
- Buy
- Sale
Signal Strength
- All
- 1
- 2
- 3
- 4
- 5


