

Pola sebenarnya

Double Bottom
was formed on 04.04 at 17:30:24 (UTC+0)
signal strength 3 of 5
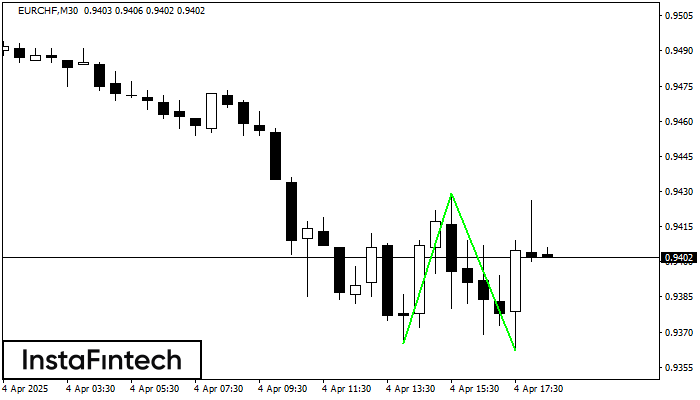
The Double Bottom pattern has been formed on EURCHF M30. Characteristics: the support level 0.9365; the resistance level 0.9429; the width of the pattern 64 points. If the resistance level is broken, a change in the trend can be predicted with the first target point lying at the distance of 67 points.
Lihat juga
- All
- All
- Bearish Rectangle
- Bearish Symmetrical Triangle
- Bearish Symmetrical Triangle
- Bullish Rectangle
- Double Top
- Double Top
- Triple Bottom
- Triple Bottom
- Triple Top
- Triple Top
- All
- All
- Buy
- Sale
- All
- 1
- 2
- 3
- 4
- 5
Bawah Ganda
was formed on 20.06 at 04:29:57 (UTC+0)
signal strength 3 of 5
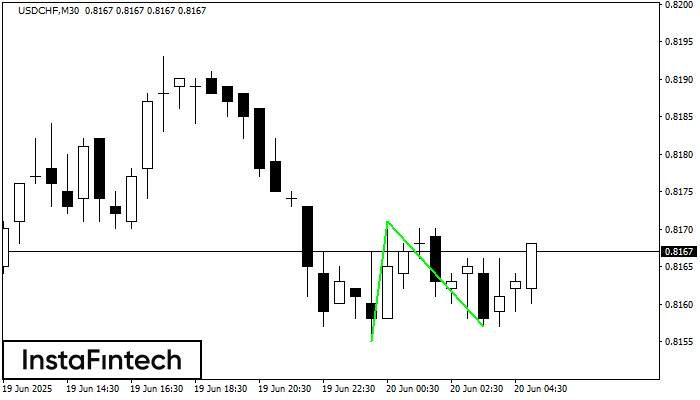
Pola Bawah Ganda telah terbentuk pada USDCHF M30. Formasi ini mensinyalkan reversal tren dari arah penurunan ke arah kenaikan. Sinyal menunjukkan bahwa transaksi beli harus dibuka setelah batas atas pola
Open chart in a new window
Panji Bullish
was formed on 20.06 at 02:45:38 (UTC+0)
signal strength 4 of 5
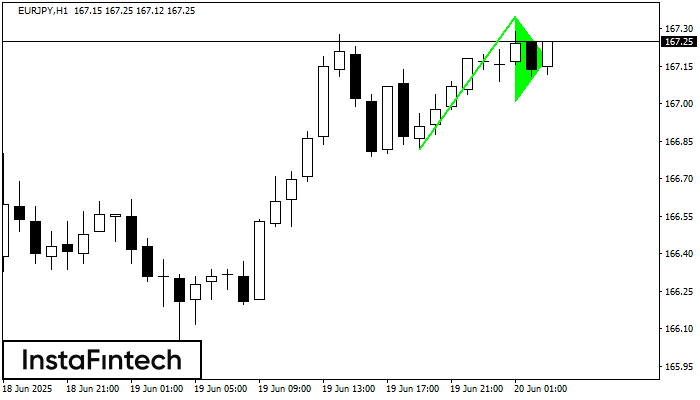
Pola grafik Panji Bullish telah terbentuk di instrumen EURJPY H1. Jenis pola ini terjadi pada kategori pola kelanjutan. Dalam kasus ini, jika kuotasi dapat menembus titik tertinggi, harga diperkirakan akan
Open chart in a new window
Persegi Bearish
was formed on 20.06 at 02:09:08 (UTC+0)
signal strength 3 of 5
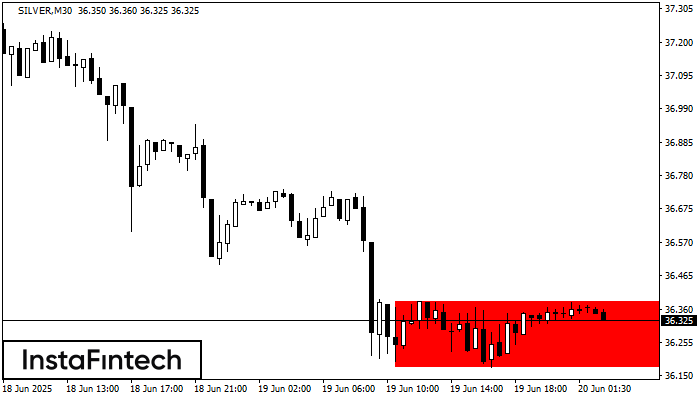
Menurut grafik dari M30, SILVER terbentuk Persegi Bearish yang merupakan pola dari kelanjutan tren. Pola terkandung di dalam batas berikut: batas lebih rendah 36.17 – 36.17 dan batas atas 36.38
Open chart in a new window


