

Pola sebenarnya

Bearish Symmetrical Triangle
was formed on 01.04 at 09:09:30 (UTC+0)
signal strength 3 of 5
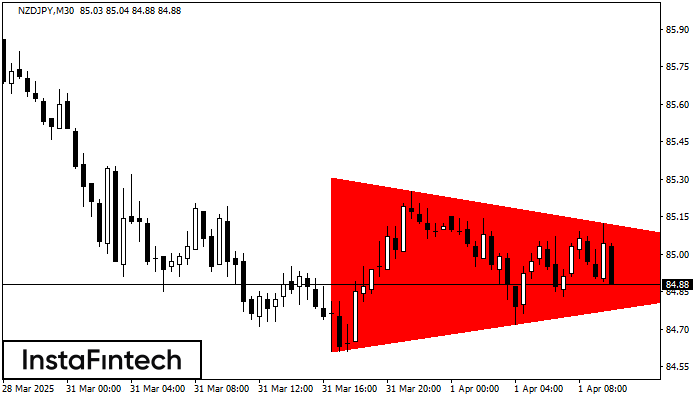
According to the chart of M30, NZDJPY formed the Bearish Symmetrical Triangle pattern. This pattern signals a further downward trend in case the lower border 84.61 is breached. Here, a hypothetical profit will equal the width of the available pattern that is -69 pips.
Lihat juga
- All
- All
- Bearish Rectangle
- Bearish Symmetrical Triangle
- Bearish Symmetrical Triangle
- Bullish Rectangle
- Double Top
- Double Top
- Triple Bottom
- Triple Bottom
- Triple Top
- Triple Top
- All
- All
- Buy
- Sale
- All
- 1
- 2
- 3
- 4
- 5
Triple Bottom
was formed on 18.04 at 20:00:39 (UTC+0)
signal strength 2 of 5

The Triple Bottom pattern has formed on the chart of AUDCAD M15. Features of the pattern: The lower line of the pattern has coordinates 0.8845 with the upper limit 0.8845/0.8836
The M5 and M15 time frames may have more false entry points.
Open chart in a new window
Triple Bottom
was formed on 18.04 at 20:00:30 (UTC+0)
signal strength 2 of 5

The Triple Bottom pattern has formed on the chart of the NZDCHF M15 trading instrument. The pattern signals a change in the trend from downwards to upwards in the case
The M5 and M15 time frames may have more false entry points.
Open chart in a new window
Triple Bottom
was formed on 18.04 at 20:00:30 (UTC+0)
signal strength 3 of 5
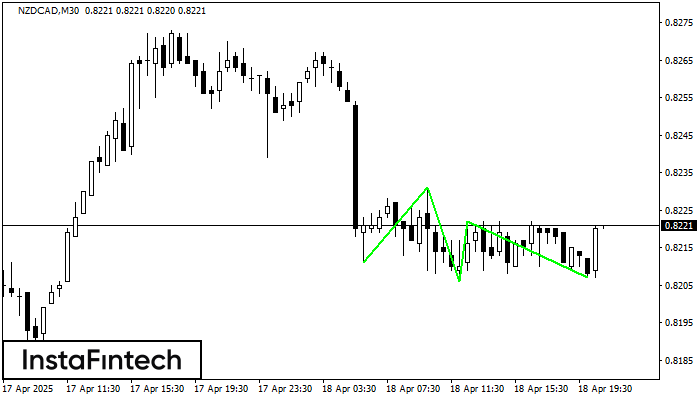
The Triple Bottom pattern has formed on the chart of the NZDCAD M30 trading instrument. The pattern signals a change in the trend from downwards to upwards in the case
Open chart in a new window


