

Pola sebenarnya

Bearish pennant
was formed on 31.03 at 16:30:30 (UTC+0)
signal strength 2 of 5
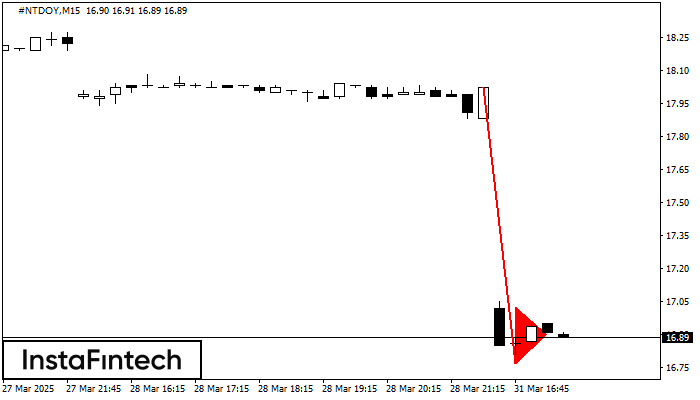
The Bearish pennant pattern has formed on the #NTDOY M15 chart. This pattern type is characterized by a slight slowdown after which the price will move in the direction of the original trend. In case the price fixes below the pattern’s low of 16.77, a trader will be able to successfully enter the sell position.
The M5 and M15 time frames may have more false entry points.
Lihat juga
- All
- All
- Bearish Rectangle
- Bearish Symmetrical Triangle
- Bearish Symmetrical Triangle
- Bullish Rectangle
- Double Top
- Double Top
- Triple Bottom
- Triple Bottom
- Triple Top
- Triple Top
- All
- All
- Buy
- Sale
- All
- 1
- 2
- 3
- 4
- 5
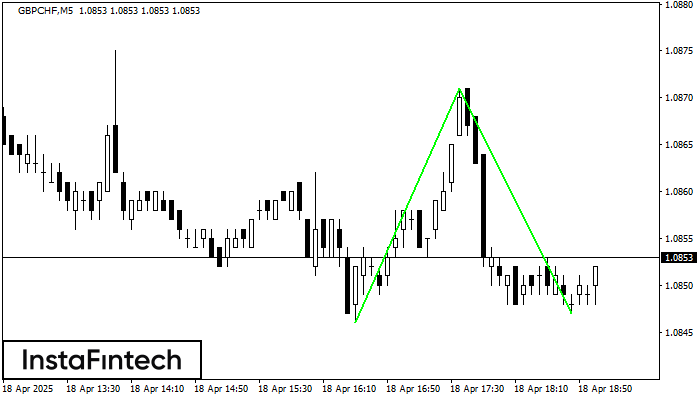
Bawah Ganda
was formed on 18.04 at 18:15:46 (UTC+0)
signal strength 2 of 5

Pola Bawah Ganda telah terbentuk pada GBPCHF M15. Formasi ini mensinyalkan reversal tren dari arah penurunan ke arah kenaikan. Sinyal menunjukkan bahwa transaksi beli harus dibuka setelah batas atas pola
Rangka waktu M5 dan M15 mungkin memiliki lebih dari titik entri yang keliru.
Open chart in a new window
Kepala dan bahu
was formed on 18.04 at 18:05:18 (UTC+0)
signal strength 1 of 5

EURJPY M5 membentuk pola Kepala dan bahu dengan beberapa fitur berikut: puncak The Head di 162.14, the Neckline dan sudut atas berada di 161.98/161.96. Formasi pola ini dapat membawa perubahan
Rangka waktu M5 dan M15 mungkin memiliki lebih dari titik entri yang keliru.
Open chart in a new window
Bawah Ganda
was formed on 18.04 at 18:05:13 (UTC+0)
signal strength 1 of 5
Pola Bawah Ganda telah terbentuk pada GBPCHF M5. Formasi ini mensinyalkan reversal tren dari arah penurunan ke arah kenaikan. Sinyal menunjukkan bahwa transaksi beli harus dibuka setelah batas atas pola
Rangka waktu M5 dan M15 mungkin memiliki lebih dari titik entri yang keliru.
Open chart in a new window


