

Pola sebenarnya

Bullish pennant
was formed on 31.03 at 14:24:54 (UTC+0)
signal strength 1 of 5
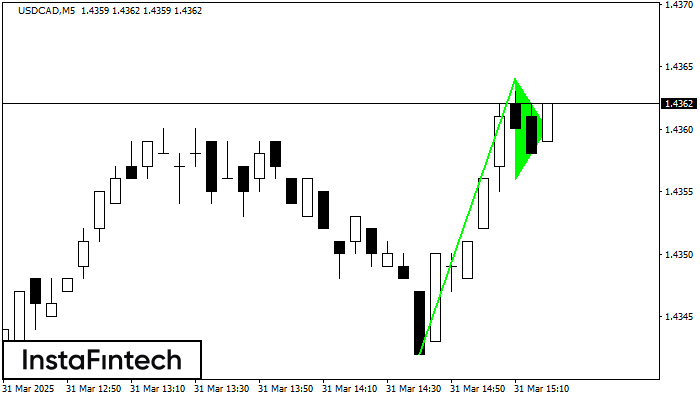
The Bullish pennant pattern is formed on the USDCAD M5 chart. It is a type of the continuation pattern. Supposedly, in case the price is fixed above the pennant’s high of 1.4364, a further uptrend is possible.
The M5 and M15 time frames may have more false entry points.
Lihat juga
- All
- All
- Bearish Rectangle
- Bearish Symmetrical Triangle
- Bearish Symmetrical Triangle
- Bullish Rectangle
- Double Top
- Double Top
- Triple Bottom
- Triple Bottom
- Triple Top
- Triple Top
- All
- All
- Buy
- Sale
- All
- 1
- 2
- 3
- 4
- 5
Bearish pennant
was formed on 15.04 at 03:46:46 (UTC+0)
signal strength 1 of 5

The Bearish pennant pattern has formed on the GBPAUD M5 chart. This pattern type is characterized by a slight slowdown after which the price will move in the direction
The M5 and M15 time frames may have more false entry points.
Open chart in a new window
Double Top
was formed on 15.04 at 03:00:21 (UTC+0)
signal strength 4 of 5
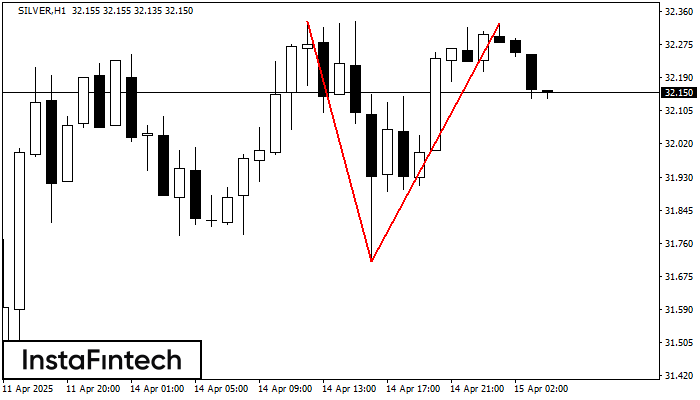
On the chart of SILVER H1 the Double Top reversal pattern has been formed. Characteristics: the upper boundary 32.33; the lower boundary 31.71; the width of the pattern 615 points
Open chart in a new window
Triple Top
was formed on 15.04 at 03:00:15 (UTC+0)
signal strength 2 of 5
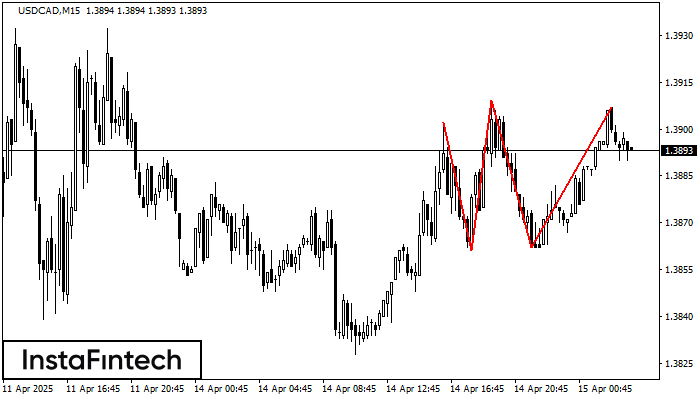
The Triple Top pattern has formed on the chart of the USDCAD M15 trading instrument. It is a reversal pattern featuring the following characteristics: resistance level -5, support level -1
The M5 and M15 time frames may have more false entry points.
Open chart in a new window


