

Pola sebenarnya

Double Top
was formed on 25.03 at 14:00:18 (UTC+0)
signal strength 1 of 5
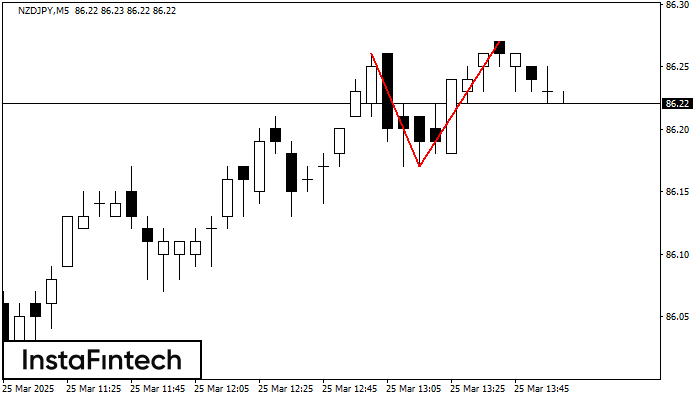
The Double Top reversal pattern has been formed on NZDJPY M5. Characteristics: the upper boundary 86.26; the lower boundary 86.17; the width of the pattern is 10 points. Sell trades are better to be opened below the lower boundary 86.17 with a possible movements towards the 86.02 level.
The M5 and M15 time frames may have more false entry points.
Lihat juga
- All
- All
- Bearish Rectangle
- Bearish Symmetrical Triangle
- Bearish Symmetrical Triangle
- Bullish Rectangle
- Double Top
- Double Top
- Triple Bottom
- Triple Bottom
- Triple Top
- Triple Top
- All
- All
- Buy
- Sale
- All
- 1
- 2
- 3
- 4
- 5
Bawah Triple
was formed on 28.03 at 13:10:00 (UTC+0)
signal strength 1 of 5
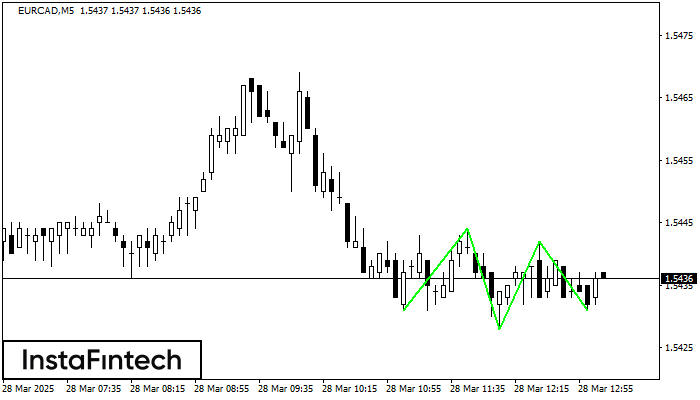
Pola Bawah Triple telah terbentuk pada grafik EURCAD M5. Fitur-fitur pola: garis bawah pola memiliki koordinat 1.5444 dengan batas atas 1.5444/1.5442, proyeksi lebar adalah 13 poin. Pembentukan pola Bawah Triple
Rangka waktu M5 dan M15 mungkin memiliki lebih dari titik entri yang keliru.
Open chart in a new window
Segitiga Simetris Bearish
was formed on 28.03 at 13:02:25 (UTC+0)
signal strength 2 of 5
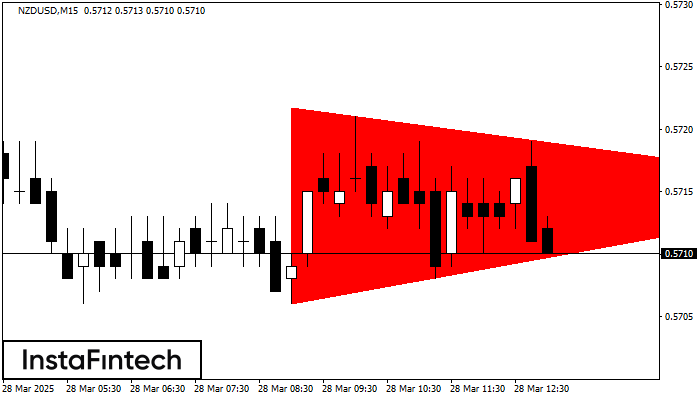
Menurut Grafik dari M15, NZDUSD dibentuk pola Segitiga Simetris Bearish. Pola ini mengisyaratkan tren penurunan lebih lanjut jika terdapat batas yang lebih rendah 0.5706 ditembus. Disini, sebuah keuntungan hipotetis akan
Rangka waktu M5 dan M15 mungkin memiliki lebih dari titik entri yang keliru.
Open chart in a new window
Kepala dan bahu
was formed on 28.03 at 12:14:49 (UTC+0)
signal strength 2 of 5
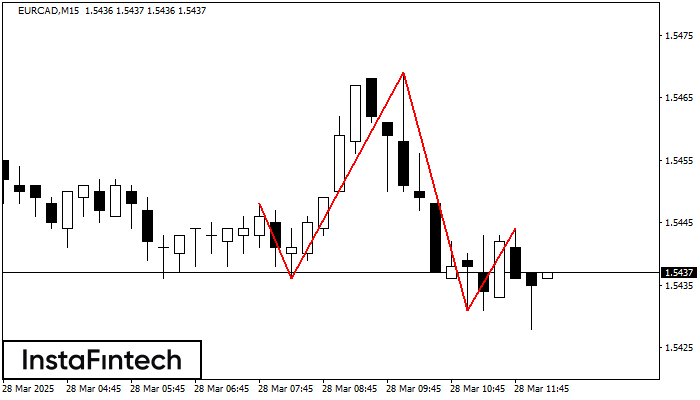
Pola teknikal yang disebut Kepala dan bahu telah muncul pada grafik EURCAD M15. Terdapat banyak alasan untuk harga melewati Neckline 1.5436/1.5431 setelah Shoulder kanan terbentuk. Jadi, tren akan berubah dengan
Rangka waktu M5 dan M15 mungkin memiliki lebih dari titik entri yang keliru.
Open chart in a new window


