

Pola sebenarnya

Double Bottom
was formed on 25.03 at 13:01:07 (UTC+0)
signal strength 4 of 5
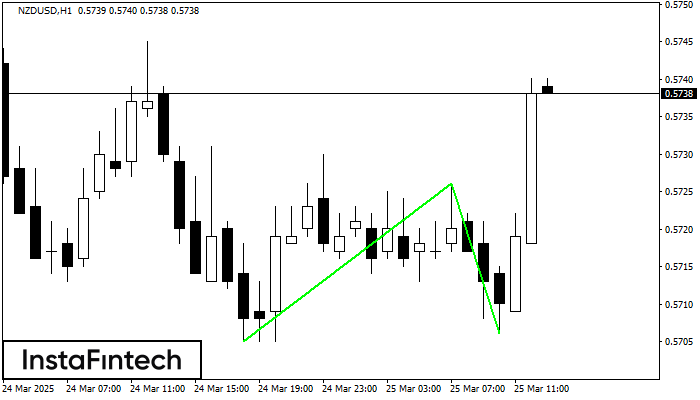
The Double Bottom pattern has been formed on NZDUSD H1. Characteristics: the support level 0.5705; the resistance level 0.5726; the width of the pattern 21 points. If the resistance level is broken, a change in the trend can be predicted with the first target point lying at the distance of 20 points.
- All
- All
- Bearish Rectangle
- Bearish Symmetrical Triangle
- Bearish Symmetrical Triangle
- Bullish Rectangle
- Double Top
- Double Top
- Triple Bottom
- Triple Bottom
- Triple Top
- Triple Top
- All
- All
- Buy
- Sale
- All
- 1
- 2
- 3
- 4
- 5
Bendera Bearish
was formed on 28.03 at 03:22:22 (UTC+0)
signal strength 1 of 5
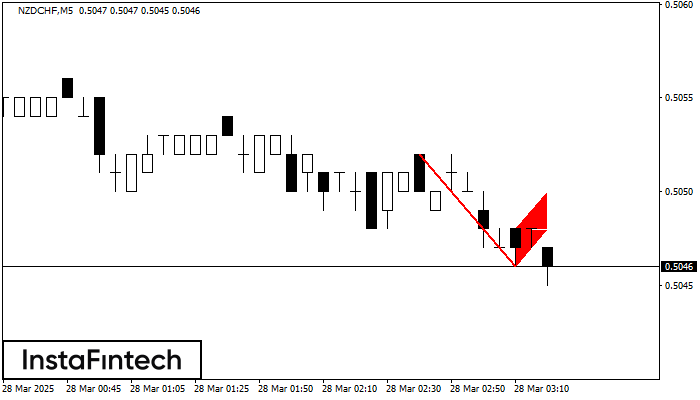
Pola Bendera Bearish telah terbentuk di grafik NZDCHF M5. Oleh karena itu, tren menurun kemungkinan akan berlanjut dalam waktu dekat. Segera setelah harga menembus ke bawah titik trendah di 0.5046
Rangka waktu M5 dan M15 mungkin memiliki lebih dari titik entri yang keliru.
Open chart in a new window
Teratas Triple
was formed on 28.03 at 03:00:27 (UTC+0)
signal strength 2 of 5
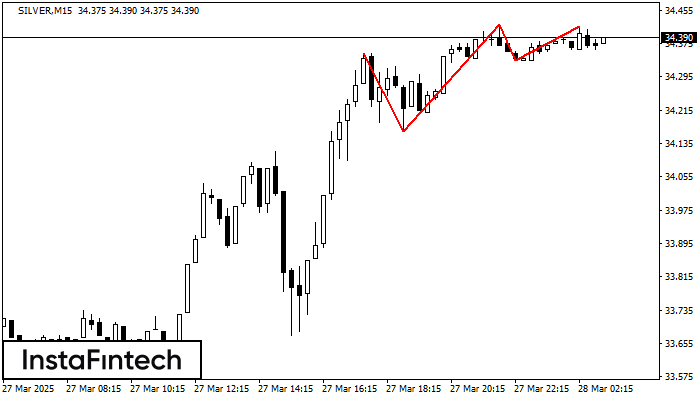
Pada grafik instrumen trading SILVER M15, pola Teratas Triple yang menandakan perubahan trend telah terbentuk. Ada kemungkinan bahwa setelah pembentukan puncak (peak) ketiga, harga akan mencoba untuk menembus level resistance
Rangka waktu M5 dan M15 mungkin memiliki lebih dari titik entri yang keliru.
Open chart in a new window
Bawah Ganda
was formed on 28.03 at 02:55:06 (UTC+0)
signal strength 1 of 5
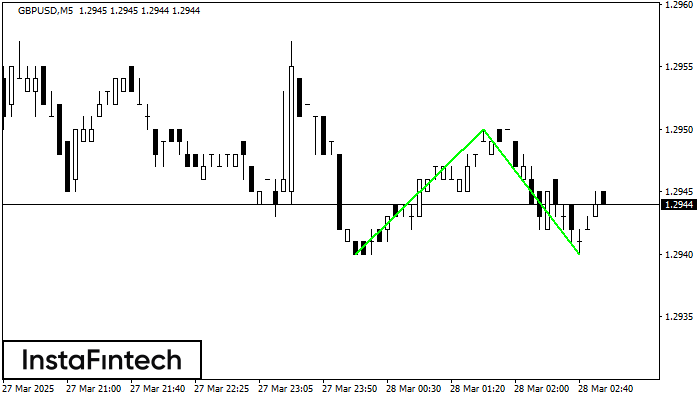
Pola Bawah Ganda telah terbentuk pada GBPUSD M5. Formasi ini mensinyalkan reversal tren dari arah penurunan ke arah kenaikan. Sinyal menunjukkan bahwa transaksi beli harus dibuka setelah batas atas pola
Rangka waktu M5 dan M15 mungkin memiliki lebih dari titik entri yang keliru.
Open chart in a new window


