

Pola sebenarnya

Triple Top
was formed on 25.03 at 12:40:11 (UTC+0)
signal strength 1 of 5
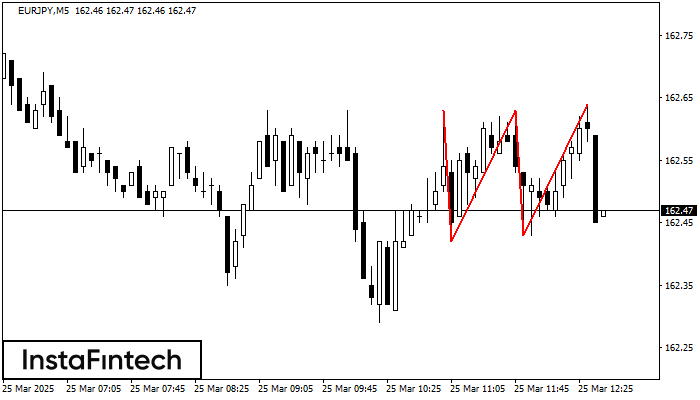
On the chart of the EURJPY M5 trading instrument, the Triple Top pattern that signals a trend change has formed. It is possible that after formation of the third peak, the price will try to break through the resistance level 162.42, where we advise to open a trading position for sale. Take profit is the projection of the pattern’s width, which is 21 points.
The M5 and M15 time frames may have more false entry points.
- All
- All
- Bearish Rectangle
- Bearish Symmetrical Triangle
- Bearish Symmetrical Triangle
- Bullish Rectangle
- Double Top
- Double Top
- Triple Bottom
- Triple Bottom
- Triple Top
- Triple Top
- All
- All
- Buy
- Sale
- All
- 1
- 2
- 3
- 4
- 5
Bearish Symmetrical Triangle
was formed on 30.04 at 20:42:11 (UTC+0)
signal strength 1 of 5
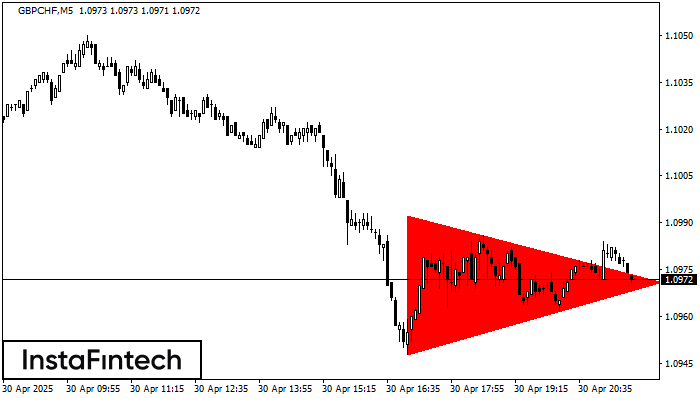
According to the chart of M5, GBPCHF formed the Bearish Symmetrical Triangle pattern. This pattern signals a further downward trend in case the lower border 1.0948 is breached. Here
The M5 and M15 time frames may have more false entry points.
Open chart in a new window
Bullish Flag
was formed on 30.04 at 20:31:46 (UTC+0)
signal strength 3 of 5

The Bullish Flag pattern has been formed on the chart #NTDOY M30 which signals that the upward trend will continue. Signals: а break of the peak at 20.76 may push
Open chart in a new window
Bullish Flag
was formed on 30.04 at 20:31:34 (UTC+0)
signal strength 3 of 5
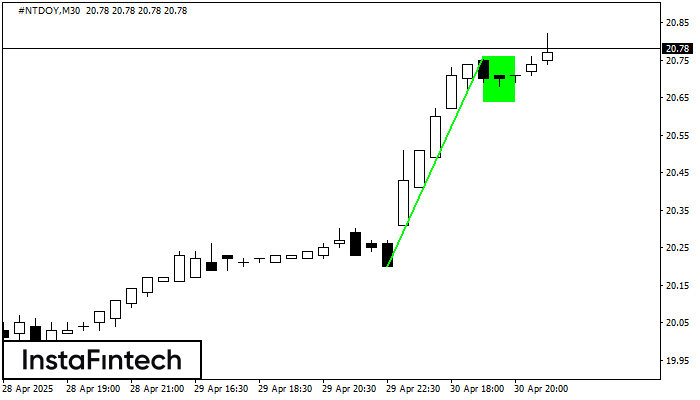
The Bullish Flag pattern which signals continuation of a trend has been formed on the chart #NTDOY M30. Forecast: if the price breaks above the pattern high at 20.76, then
Open chart in a new window


