

Pola sebenarnya

Double Bottom
was formed on 24.03 at 21:01:22 (UTC+0)
signal strength 3 of 5
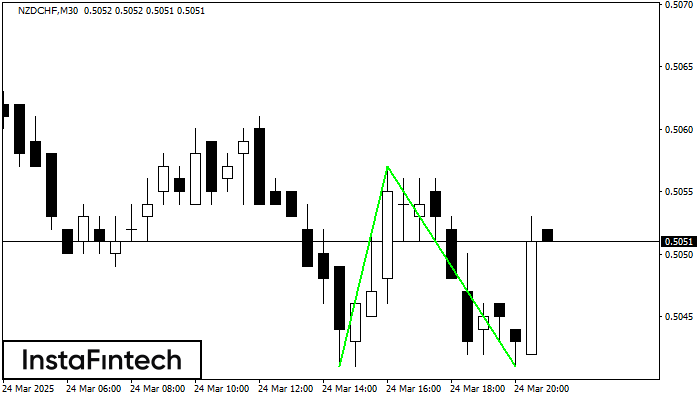
The Double Bottom pattern has been formed on NZDCHF M30. This formation signals a reversal of the trend from downwards to upwards. The signal is that a buy trade should be opened after the upper boundary of the pattern 0.5057 is broken. The further movements will rely on the width of the current pattern 16 points.
- All
- All
- Bearish Rectangle
- Bearish Symmetrical Triangle
- Bearish Symmetrical Triangle
- Bullish Rectangle
- Double Top
- Double Top
- Triple Bottom
- Triple Bottom
- Triple Top
- Triple Top
- All
- All
- Buy
- Sale
- All
- 1
- 2
- 3
- 4
- 5
Bawah Ganda
was formed on 18.04 at 19:15:27 (UTC+0)
signal strength 2 of 5
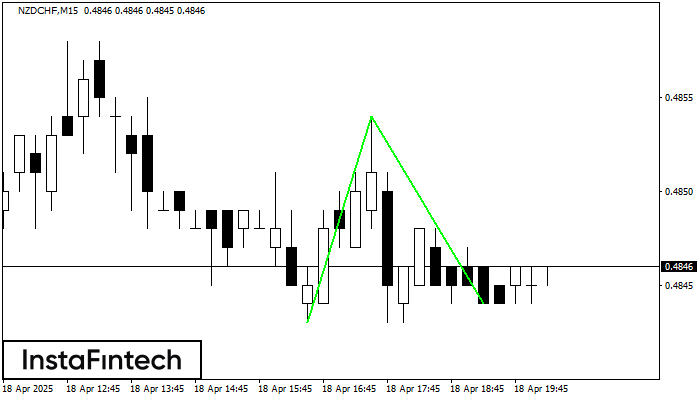
Pola Bawah Ganda telah terbentuk pada NZDCHF M15; batas atas di 0.4854; batas bawah di 0.4844. Lebar pola sebesar 11 poin. Jika harga menembus batas atas 0.4854, Perubahan dalam tren
Rangka waktu M5 dan M15 mungkin memiliki lebih dari titik entri yang keliru.
Open chart in a new window
Bawah Ganda
was formed on 18.04 at 18:15:46 (UTC+0)
signal strength 2 of 5

Pola Bawah Ganda telah terbentuk pada GBPCHF M15. Formasi ini mensinyalkan reversal tren dari arah penurunan ke arah kenaikan. Sinyal menunjukkan bahwa transaksi beli harus dibuka setelah batas atas pola
Rangka waktu M5 dan M15 mungkin memiliki lebih dari titik entri yang keliru.
Open chart in a new window
Kepala dan bahu
was formed on 18.04 at 18:05:18 (UTC+0)
signal strength 1 of 5

EURJPY M5 membentuk pola Kepala dan bahu dengan beberapa fitur berikut: puncak The Head di 162.14, the Neckline dan sudut atas berada di 161.98/161.96. Formasi pola ini dapat membawa perubahan
Rangka waktu M5 dan M15 mungkin memiliki lebih dari titik entri yang keliru.
Open chart in a new window


