

Pola sebenarnya

Double Bottom
was formed on 24.03 at 20:46:19 (UTC+0)
signal strength 2 of 5
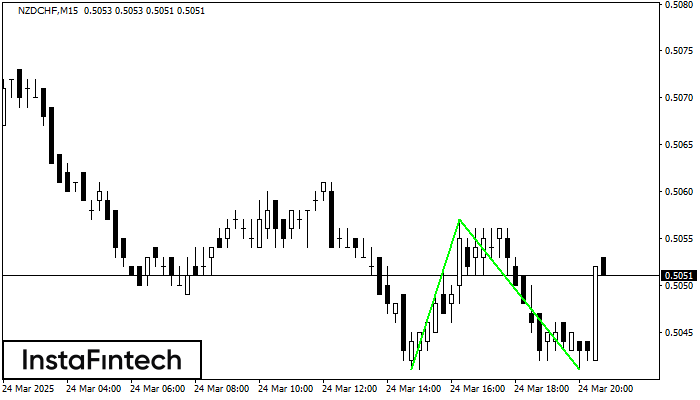
The Double Bottom pattern has been formed on NZDCHF M15. This formation signals a reversal of the trend from downwards to upwards. The signal is that a buy trade should be opened after the upper boundary of the pattern 0.5057 is broken. The further movements will rely on the width of the current pattern 16 points.
The M5 and M15 time frames may have more false entry points.
Lihat juga
- All
- All
- Bearish Rectangle
- Bearish Symmetrical Triangle
- Bearish Symmetrical Triangle
- Bullish Rectangle
- Double Top
- Double Top
- Triple Bottom
- Triple Bottom
- Triple Top
- Triple Top
- All
- All
- Buy
- Sale
- All
- 1
- 2
- 3
- 4
- 5
Segitiga Simetris Bullish
was formed on 30.04 at 21:56:12 (UTC+0)
signal strength 2 of 5

Menurut Grafik dari M15, #Bitcoin dibentuk pola Segitiga Simetris Bullish. Batas yang lebih rendah dari pola menyentuh kordinat 92482.78/94081.93 dimana batas atas berada sepanjang 95186.64/94081.93. Jika pola Segitiga Simetris Bullish
Rangka waktu M5 dan M15 mungkin memiliki lebih dari titik entri yang keliru.
Open chart in a new window
Teratas Ganda
was formed on 30.04 at 21:40:15 (UTC+0)
signal strength 1 of 5
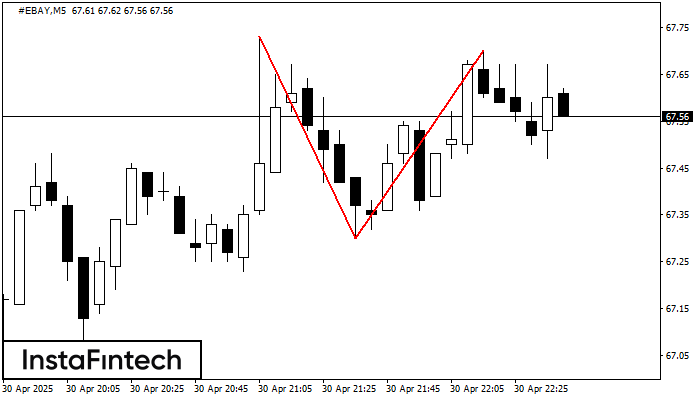
Pola reversal Teratas Ganda telah terbentuk pada #EBAY M5. Karakteristik: batas atas 67.73; batas bawah 67.30; lebar pola 40 poin. Transaksi jual lebih baik dibuka di bawah batas bawah 67.30
Rangka waktu M5 dan M15 mungkin memiliki lebih dari titik entri yang keliru.
Open chart in a new window
Bawah Ganda
was formed on 30.04 at 21:30:36 (UTC+0)
signal strength 1 of 5
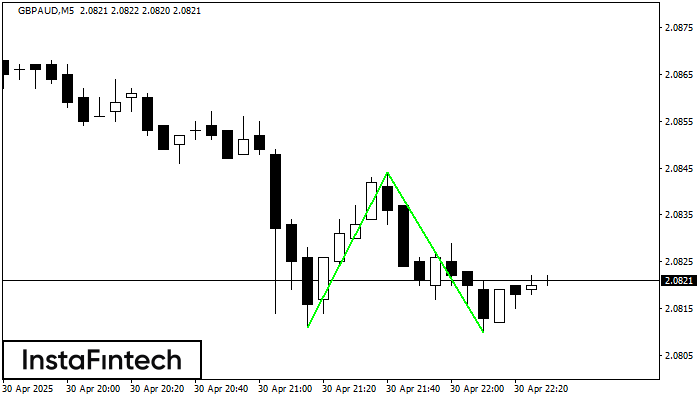
Pola Bawah Ganda telah terbentuk pada GBPAUD M5; batas atas di 2.0844; batas bawah di 2.0810. Lebar pola sebesar 33 poin. Jika harga menembus batas atas 2.0844, Perubahan dalam tren
Rangka waktu M5 dan M15 mungkin memiliki lebih dari titik entri yang keliru.
Open chart in a new window


