

Pola sebenarnya

Bearish Rectangle
was formed on 24.03 at 19:11:46 (UTC+0)
signal strength 1 of 5
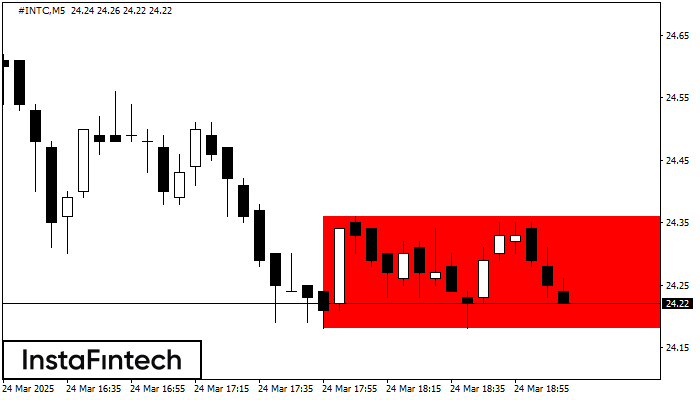
According to the chart of M5, #INTC formed the Bearish Rectangle. The pattern indicates a trend continuation. The upper border is 24.36, the lower border is 24.18. The signal means that a short position should be opened after fixing a price below the lower border 24.18 of the Bearish Rectangle.
The M5 and M15 time frames may have more false entry points.
- All
- All
- Bearish Rectangle
- Bearish Symmetrical Triangle
- Bearish Symmetrical Triangle
- Bullish Rectangle
- Double Top
- Double Top
- Triple Bottom
- Triple Bottom
- Triple Top
- Triple Top
- All
- All
- Buy
- Sale
- All
- 1
- 2
- 3
- 4
- 5
Bullish Flag
сформирован 09.06 в 12:15:23 (UTC+0)
сила сигнала 1 из 5
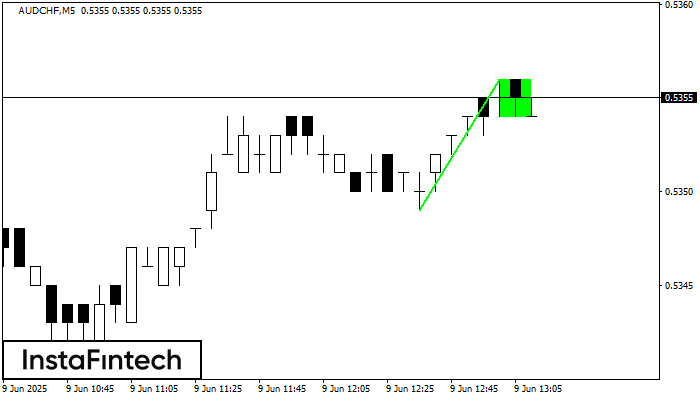
The Bullish Flag pattern which signals continuation of a trend has been formed on the chart AUDCHF M5. Forecast: if the price breaks above the pattern high at 0.5356, then
The M5 and M15 time frames may have more false entry points.
Открыть график инструмента в новом окне
Bullish pennant
сформирован 09.06 в 11:21:46 (UTC+0)
сила сигнала 2 из 5
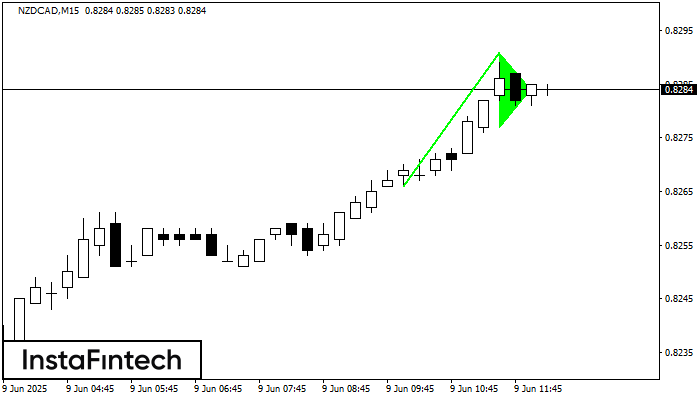
The Bullish pennant graphic pattern has formed on the NZDCAD M15 instrument. This pattern type falls under the category of continuation patterns. In this case, if the quote can breaks
The M5 and M15 time frames may have more false entry points.
Открыть график инструмента в новом окне
Triple Bottom
сформирован 09.06 в 11:01:02 (UTC+0)
сила сигнала 3 из 5
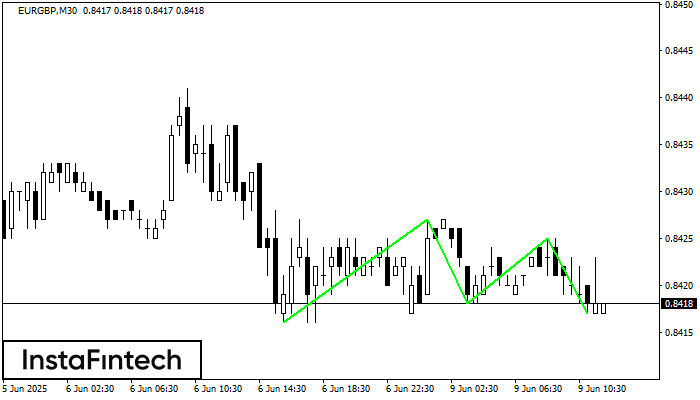
The Triple Bottom pattern has formed on the chart of the EURGBP M30 trading instrument. The pattern signals a change in the trend from downwards to upwards in the case
Открыть график инструмента в новом окне

