Lihat juga


 28.03.2025 10:09 AM
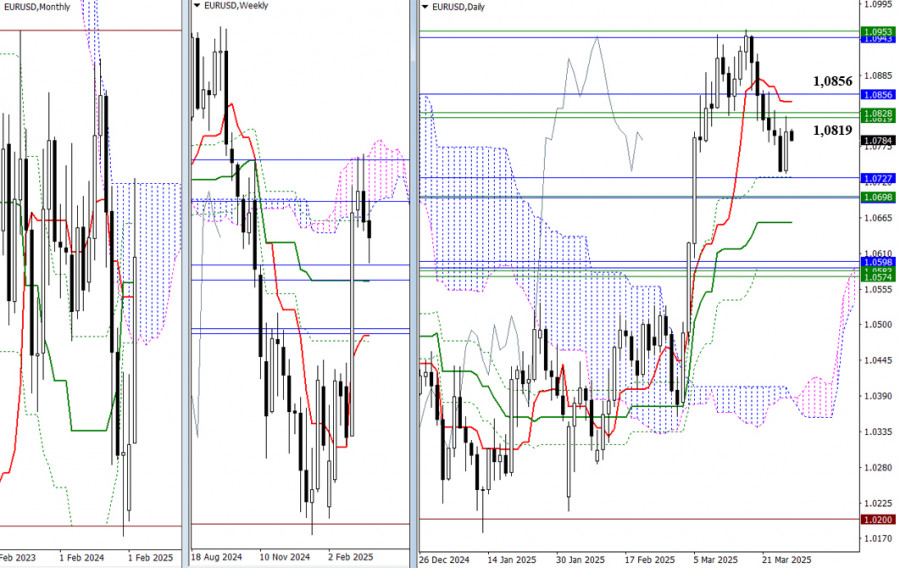
As the week comes to an end, the market remains indecisive, with no clear preferences evident. Yesterday, the bulls made some progress, adjusting the prevailing bearish sentiment. To confirm and consolidate the result, they need to overcome the cluster of resistance levels from various timeframes in the 1.0819–1.0856 area. After that, a new opportunity for further growth will open up, with the following targets being the upper boundaries of the weekly (1.0953) and monthly (1.0943) Ichimoku clouds. If the bulls surrender their gains from yesterday, the pair may return to support levels around 1.0727–1.0694.
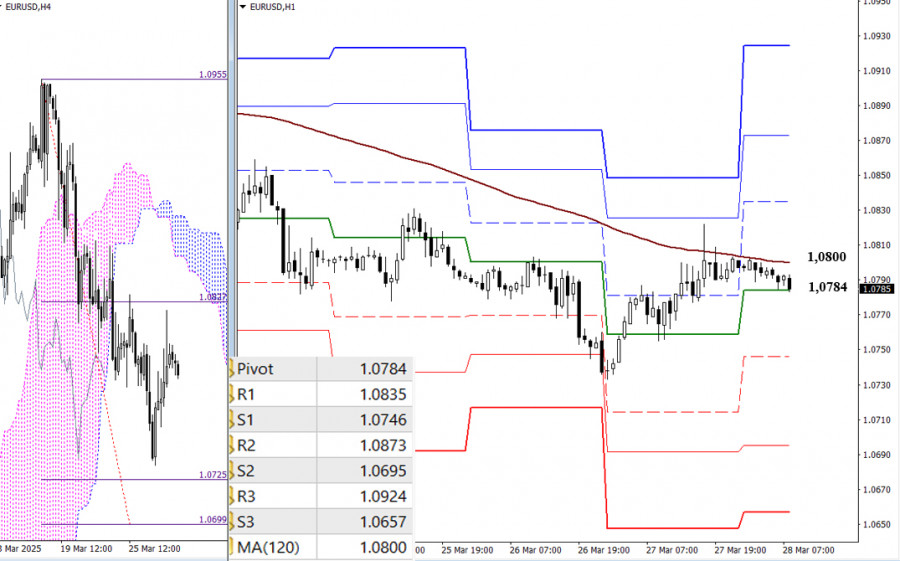
On the lower timeframes, the pair is currently testing the resistance of the weekly long-term trend (1.0800). Holding this level gives a significant advantage. If the bulls manage to consolidate above this level and reverse the trend in their favor, they can test the resistance levels of the classic Pivot Points intraday (1.0835 – 1.0873 – 1.0924). If the trend is not broken, the advantage will remain on the bearish side. If the decline resumes, support will be provided by the classic Pivot Points today at 1.0746 – 1.0695 – 1.0657.
***
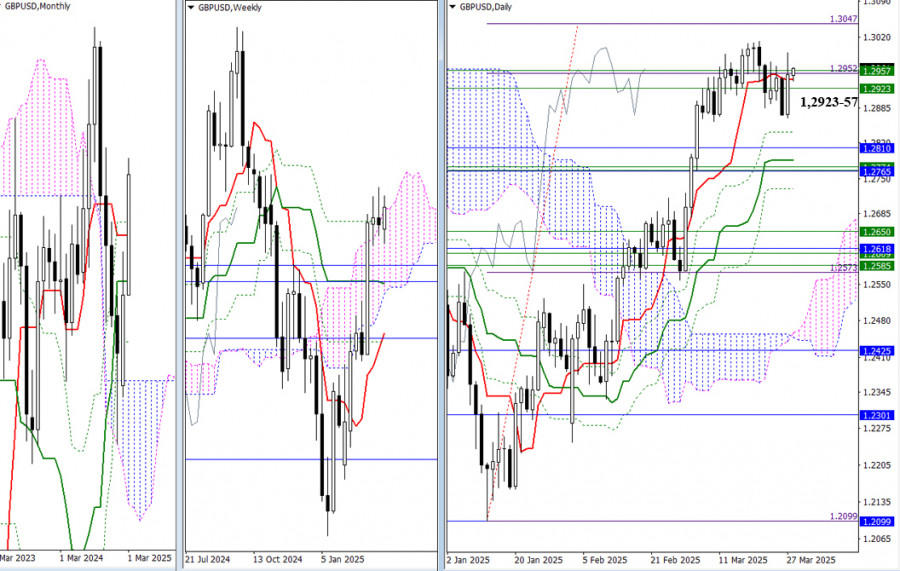
The market remains within a range of uncertainty that has persisted from previous weeks, remaining in the gravitational zone and influence of the weekly levels (1.2923 – 1.2957) and the daily short-term trend (1.2940). The main expectations have not changed, and the key reference points remain in place. The next upside target remains the 100% completion level of the daily breakout target above the Ichimoku cloud (1.3047), while the cluster of levels of interest to the bears is still located around 1.2765–1.2810, where monthly, weekly, and daily supports are gathered.
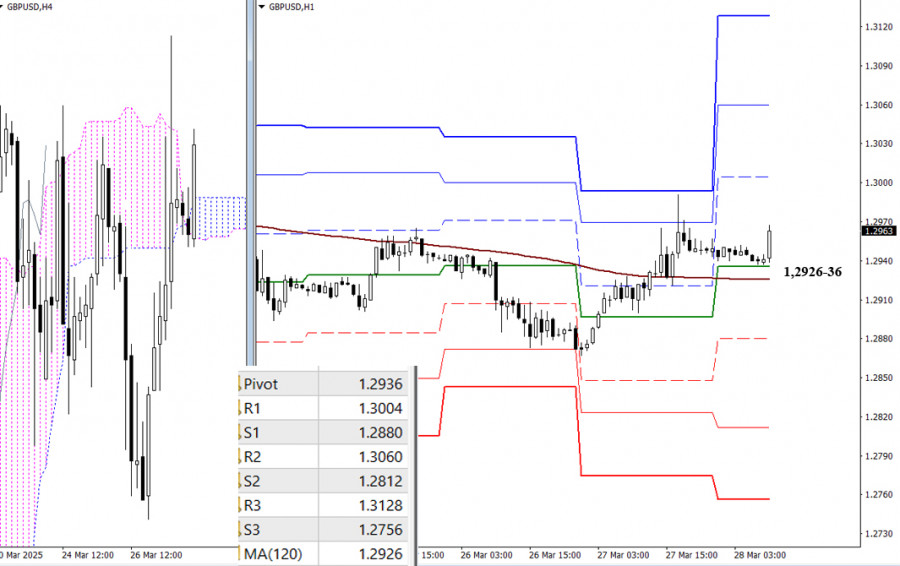
The bulls consolidated above the key levels of 1.2936 (daily central Pivot Point) and 1.2926 (weekly long-term trend), thereby gaining the main advantage on the lower timeframes. Intraday, further upside development today will proceed through the resistance levels of the classic Pivot Points (1.3004 – 1.3060 – 1.3128). A loss of the key levels (1.2936–26) will shift the current balance of power in favor of bearish sentiment. In that case, the market will focus on the support levels of the classic Pivot Points (1.2880 – 1.2812 – 1.2756).
***
You have already liked this post today
*Analisis pasar yang diposting disini dimaksudkan untuk meningkatkan pengetahuan Anda namun tidak untuk memberi instruksi trading.
Penurunan suku bunga oleh Reserve Bank of Australia kemarin dari 4,10% menjadi 3,85%, meskipun sudah diperkirakan secara luas, tidak memungkinkan dolar Australia untuk mengkonsolidasikan di atas level resistensi 0,6444. Namun
Meski di chart 4 jamnya pasangan mata uang silang AUD/JPY tengah melemah, namun nampaknya pelemahan ini hanya bersifat koreksi sesaat selama tidak sampai tembus dan menutup dibawah level 91,47 maka
Pasangan USD/CAD turun secara bertahap selama lima hari berturut-turut, tetap berada di bawah garis indikator keseimbangan harian. Pergerakan di bawah level support 1,3898 akan mempercepat penurunan menuju support pertama
Pada chart 4 jamnya, instrumen komoditi Perak nampak terlihat kemunculan Konvergen antara pergerakan harga instrument komoditi Perak dengan indikator Stochastic Oscillator, sehingga dalam waktu dekat ini Perak berpotensi untuk menguat
Jika harga turun di bawah 3.281, instrumen ini diprediksi akan menutup celah di 3.201, atau sebaliknya, konsolidasi di atas 3.290 diharapkan akan menutup celah yang ditinggalkannya sekitar 3.325 pada
Euro telah meninggalkan celah di sekitar 1,1170. Jika EUR/USD jatuh di bawah level 6/8 Murray yang terletak di 1,1230, tekanan bearish dapat meningkat, dengan harga berpotensi menutupi celah
 InstaFutures
Make money with a new promising instrument!
Akun PAMM
InstaTrade

Your IP address shows that you are currently located in the USA. If you are a resident of the United States, you are prohibited from using the services of InstaFintech Group including online trading, online transfers, deposit/withdrawal of funds, etc.
If you think you are seeing this message by mistake and your location is not the US, kindly proceed to the website. Otherwise, you must leave the website in order to comply with government restrictions.
Why does your IP address show your location as the USA?
Please confirm whether you are a US resident or not by clicking the relevant button below. If you choose the wrong option, being a US resident, you will not be able to open an account with InstaTrade anyway.
We are sorry for any inconvenience caused by this message.


