Lihat juga


 13.04.2023 11:06 PM
Overview:
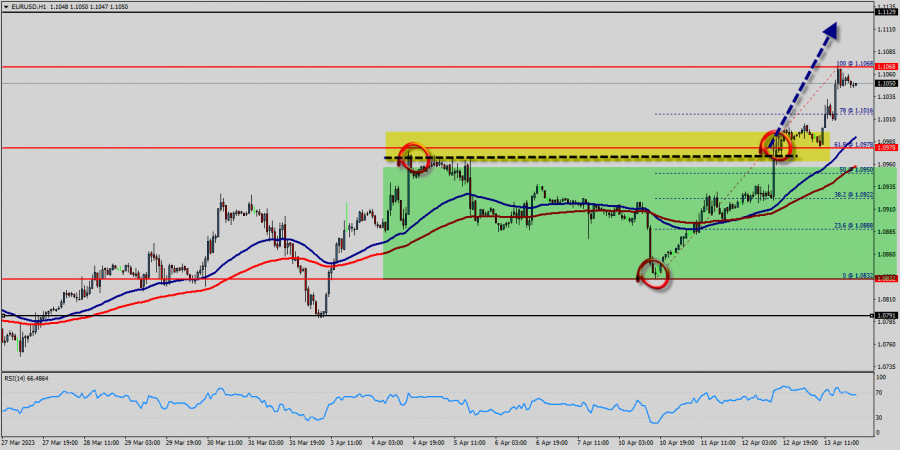
The EUR/USD pair will continue to rise from the level of 1.0978. The support is found at the level of 1.0978, which represents the 61.8% Fibonacci retracement level in the H1 time frame.
The price is likely to form a double bottom. Today, the major support is seen at 1.0832, while immediate resistance is seen at 1.1068. Accordingly, the EUR/USD pair is showing signs of strength following a breakout of a high at 1.1068.
Moreover, the RSI starts signaling an upward trend, and the trend is still showing strength above the moving average (100). Hence, the market is indicating a bullish opportunity above the area of 1.0978. So, the market is likely to show signs of a bullish trend around 1.0978 - 1.1000. In other words, buy orders are recommended above the ratio of 61.8% Fibonacci (1.0978).
So, buy above the level of 1.1068 with the first target at 1.1129 in order to test the daily resistance 1 and move further to 1.1150.
Also, the level of 1.1150 is a good place to take profit because it will form a new double top.
Amid the previous events, the pair is still in an uptrend; for that we expect the EUR/USD pair to climb from 1.0979 to 1.1129 today.
At the same time, in case a reversal takes place and the EUR/USD pair breaks through the support level of 1.0979, a further decline to 1.0832 can occur, which would indicate a bearish market.
You have already liked this post today
*Analisis pasar yang diposting disini dimaksudkan untuk meningkatkan pengetahuan Anda namun tidak untuk memberi instruksi trading.
Dengan munculnya Convergence antara pergerakan harga instrument komoditi Platinum dengan indikator Stochastic Oscillator serta ditunjang oleh pergerakan harganya yang bergerak diatas WMA (210 yang juga memiliki kemiringan slope yang menuki
Bila Kita perhatikan chart 4 jamnya pasangan mata uang komoditi USD.CAD nampak terlihat munculnya Divergent antara pergerakan harganya dengan indikator Stochastic Oscillator sehingga meski saat ini The Lonnie masih berada
Rencana trading kami untuk beberapa jam ke depan adalah menjual euro di bawah puncak saluran tren turun, dengan target di 1.1189, dan menutup celah yang tertinggal minggu lalu sekitar 1.1150
Emas meninggalkan celah lain pada 8 Mei di sekitar level 3.325 dan kemungkinan akan menembus ke atas 3.250. Prospeknya mungkin bullish, dan kita mungkin mengantisipasi emas menutup celah
Pada hari Jumat, pasangan EUR/USD melanjutkan penurunan moderatnya. Penutupan di bawah level Fibonacci 127,2% di 1,1181 tercatat, tetapi penjual gagal memanfaatkan keberhasilan tersebut. Latar belakang berita saat ini beragam
Pada grafik per jam, pasangan GBP/USD terus bergerak menyamping pada hari Jumat, berfluktuasi antara level 1.,3205 dan 1,3344. Setelah penolakan dari zona resistance 1,3344–1,3357, masih ada kemungkinan penurunan berlanjut menuju
Pada chart 4 jamnya, indikator Stochastic Oscillator nampak tengah terjadi crossing BUY, ditambah dengan pergerakan harganya yang bergerak diatas WMA (21) serta munculnya pola Bullish 123, maka selama tidak terjadi
Meski Seller masih mendominasi EUR/JPY di chart 4 jamnya, dimana hal ini dikonfirmasi oleh pergerakan harganya yang bergerak dibawah WMA (21) yang juga memiliki kemiringan menukik turun, namun dengan kemunculan
Chart Forex
versi web
Your IP address shows that you are currently located in the USA. If you are a resident of the United States, you are prohibited from using the services of InstaFintech Group including online trading, online transfers, deposit/withdrawal of funds, etc.
If you think you are seeing this message by mistake and your location is not the US, kindly proceed to the website. Otherwise, you must leave the website in order to comply with government restrictions.
Why does your IP address show your location as the USA?
Please confirm whether you are a US resident or not by clicking the relevant button below. If you choose the wrong option, being a US resident, you will not be able to open an account with InstaTrade anyway.
We are sorry for any inconvenience caused by this message.

