Lihat juga


 27.07.2022 06:41 AM
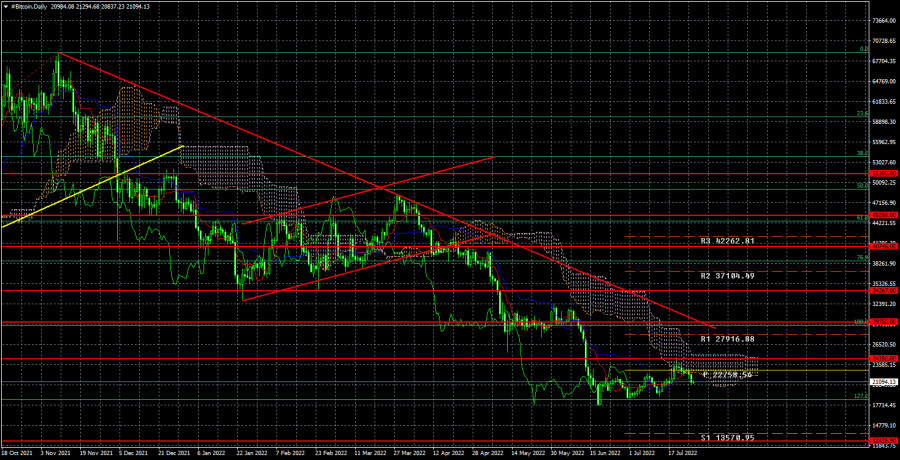
This week, the world's first cryptocurrency increased to $ 24,350. This level is significant, and we determined bitcoin's future trend by fixing it below. This level was first breached, but the price could not gain a foothold above it and rebound. As a result, we already have signals for new "bitcoin" sales. Furthermore, the descending trend line is still in play, and the cryptocurrency has yet to approach it. It also suggests market participants are still in a "bearish" mood. It turns out that a one-and-a-half-month pause, during which bitcoin has adjusted by $ 6.5 thousand, is exactly that: a pause, but not the end of a downward trend. As a result, even technical analysis continues to point to a very likely new fall.
In theory, the fall has already begun. Bitcoin may return to its annual lows in the near future, and because it has not moved far enough away from them, there is every reason to believe that they will be overcome. Following that, the drop will commence with a target of $12,426. The fundamental history of "bitcoin" is still very complicated. All those experts who projected bitcoin would be worth $100,000 in 2021 and then again in 2022 are missing something. Naturally, everyone is blaming the Fed for what is happening, as if the Fed's job is to boost bitcoin's value! As a result, the projection for bitcoin is similar to that for US stock indices: it should rebound to pre-pandemic levels. And as previously said, these tiers are positioned near the $6,000 level. The possibility of the "bitcoin" falling remains high, in our opinion.
Today, the Fed will hike the key rate by at least 0.75 percent, which might spark a new crash. Naturally, the collapse could start tonight. The markets have long been aware of the Fed's plans, so any decisions tonight will not surprise them. However, given the constant and continuous tightening of monetary policy, the first cryptocurrency has no other option but to fall.
During the 24-hour period, the "bitcoin" quotes were set below the level of $ 24,350. As a result, the target is now $ 12,426. The "bitcoin" attempted three times to break through the $ 18,500 (127.2 percent Fibonacci) but failed each time. In theory, bitcoin can now fall to any value, including zero. Of course, this is unlikely to happen, but we believe the rate of 5-10 thousand dollars per coin will become a reality in 2022. The recovery from $24,350 is a new sales indication. This indication will be confirmed if the price falls below $18,500.
You have already liked this post today
*Analisis pasar yang diposting disini dimaksudkan untuk meningkatkan pengetahuan Anda namun tidak untuk memberi instruksi trading.
Pada chart hariannya indeks Nasdaq 100 nampak terlihat baik pergerakan harga maupun Tenkansen, Kinjun Sen, serta Chikou Span berada diatas Kumo dimana berarti momentum Bullish masih cukup kuat namun dengan
Dengan kondisi Tenkansen & Kinjunsen yang berpotongan Golden Cross diatas Kumo dan Chikou Span beserta pergerakan harganya yang berada diatas Kumo juga maka dapat dipastikan saat ini bias dari indeks
Pada chart hariannya pasangan mata uang silang GBP/AUD nampak pergerakan harganya bergerak dibawah Kumo diikuti oleh Chikou Span dan Tenkansen dan Kinjun Sen (Death Cross) yang juga berada dibawah Kumo
Dengan kondisi Tenkansen dan Kinjunsen yang berada didalam Kumo serta Chikou Span yang kini berada ditengah2 batang Bar Chart menandakan saat ini AUD/JPY tengah bergerak dalam kondisi Sideways di chart
EURUSD diperdagangkan di sekitar 1.0980. Dalam istilah cloud Ichimoku, tren tetap bullish. EURUSD membuat level tertinggi di 1.1017 dan telah berbalik turun untuk menguji support tenkan-sen (indikator garis merah)
EURUSD diperdagangkan di sekitar 1,0950. Dalam istilah Ichimoku Cloud pada grafik 4 jam, tren tetap bullish karena harga terus berada di atas Kumo (Cloud). Rentang Chikou (indikator garis hitam) tetap
USDJPY diperdagangkan di sekitar 148,43. Dalam istilah cloud ichimoku, tren kini netral karena harga telah memasuki Daily Kumo (cloud). Ini adalah sinyal adanya pelemahan. Harga tidak mampu mendorong di atas
Harga emas diperdagangkan di atas $2.010 dan membuat level tertinggi baru yang lebih tinggi dibandingkan dengan level tertinggi bulan Oktober. Dalam istilah awan Ichimoku, tren tetap bullish. Harga emas berada
EURUSD diperdagangkan di sekitar 1.0950. Pada grafik 4 jam, harga diperdagangkan di atas Ichimoku cloud (bullish). Chikou span (indikator garis hitam) berada di atas pola candlestick (bullish), sementara tenkan-sen (indikator
USDJPY diperdagangkan di sekitar 148.80. Hari ini harga sangat dekat untuk memasuki Kumo (cloud) harian dan mengubah tren dari bullish ke netral. Harga memantul dari support cloud dan menguji tenkan-sen
InstaTrade dalam angka

Your IP address shows that you are currently located in the USA. If you are a resident of the United States, you are prohibited from using the services of InstaFintech Group including online trading, online transfers, deposit/withdrawal of funds, etc.
If you think you are seeing this message by mistake and your location is not the US, kindly proceed to the website. Otherwise, you must leave the website in order to comply with government restrictions.
Why does your IP address show your location as the USA?
Please confirm whether you are a US resident or not by clicking the relevant button below. If you choose the wrong option, being a US resident, you will not be able to open an account with InstaTrade anyway.
We are sorry for any inconvenience caused by this message.


