Lihat juga


 10.06.2022 11:14 AM
Hi everyone!
Traditionally, I make an analysis of the euro/pound par on Friday. In today's two previous articles on the euro/dollar and pound/dollar pairs, I analyzed the results of yesterday's ECB meeting, the market reaction, and the main risks for the UK economy. For this reason, in this article, I will focus mainly on the technical analysis of EUR/GBP. Let's look at the weekly chart.
Weekly
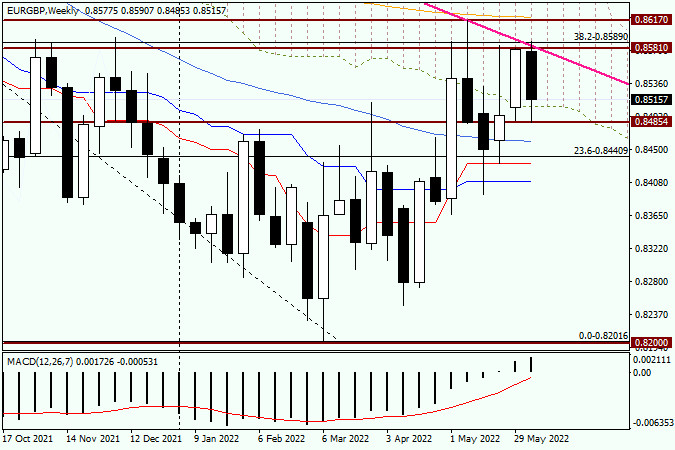
Despite the fact that the euro/pound finished last week near the Ichimoku Cloud, the bears were not ready to give up. As seen on the chart, the pair has been trading in a bearish channel during this week. Sellers have even tried to push the price below the Ichimoku Cloud. Thus, they will do everything possible to end the week near the cloud. Some sellers will try to complete the week near the indicator, while others, on the contrary, will try to push the price down. Judging by technical indicators, there is a strong resistance area of 0.8581-0.8617. At the first level, the highest level of last week was located. The bulls' attempts to break through the resistance level of 0.8581 only led to a false breakout.
The support level indicates last week's lows as trading was carried out at 0.8487. The attempts of bears to push the pair below this level were also unsuccessful. Given the technical outlook on the weekly chart, the bullish trend is possible only after a breakout of the resistance level of 0.8617 and the 200 exponential moving average, which is located at this level. Bears have a more difficult task. They need to push the price to all previously passed indicators: 50 moving average, the Tenkan, and Kijun lines. Currently, the pair is n the correction phase. After a decline to 0.9216-0.8201, the pair retreated to the Fibonacci level of 38.2 which shows a bearish trend. Thus, the EUR/GBP pair is in a downtrend channel. It is also confirmed by the pink resistance line. Attempts to break through this line were also unsuccessful.
Daily
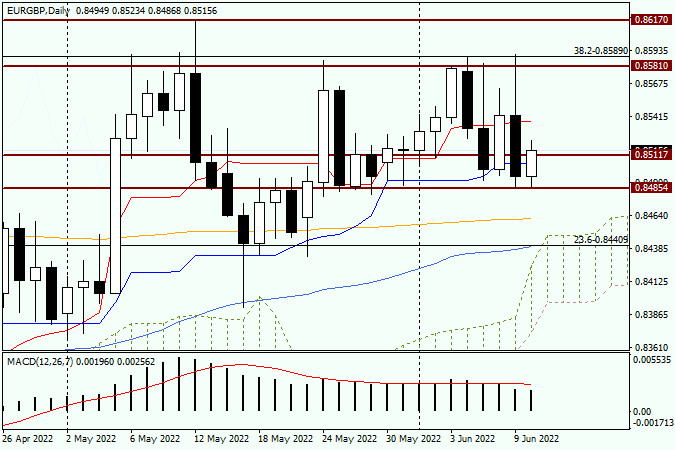
Yesterday's daily candlestick is very similar to the one that was formed for the EUR/GBP pair. After a rise to 0.8590, there was a sharp downward reversal to 0.8485. Apparently, this is a strong technical level as it has stopped yesterday's fall but also facilitated today's growth. If the euro/pound pair continues to rise, it will face resistance near the Tenkan red line, which runs at 0.8538. The pair is trading near 0.8517. Bulls and bears are likely to tussle for the closing price of the day and week near the psychologically important level of 0.8500. Given trader's disappointment with the ECB's rhetoric, as well as yesterday's bearish candlestick with a long upper shadow, the likelihood of a decline is high. It is better to wait for the convergence with the Tenkan line. After that, I would advise you to monitor bearish candlestick patterns on the weekly or smaller charts. If they appear, it will be a sell signal.
Have a wonderful weekend!
You have already liked this post today
*Analisis pasar yang diposting disini dimaksudkan untuk meningkatkan pengetahuan Anda namun tidak untuk memberi instruksi trading.
Pada hari Selasa, pasangan EUR/USD berbalik menguntungkan euro dan naik ke zona resistance 1,1374–1,1383. Pemantulan dari zona ini memicu penurunan yang menguntungkan dolar AS, dengan pasangan ini kembali turun menuju
Bila Kita perhatikan chart 4 jam dari pasangan mata uang silang AUD/JPY, maka akan nampak pola Descending Broadening Wedge dimana pola ini memberi petunjuk kalau dalam waktu dekat ini AUD/JPY
Pada chart 4 jamnya, instrumen komoditi Gas Alam nampak terlihat pola bearish 123 yang diikuti oleh bearish Ross Hook (RH) ditambah konfirmasi pergerakan harga berada dibawah WMA (21) yang juga
Sebenarnya, euro sedang mengalami kelelahan. Jadi, prospek penurunan bisa tetap berlaku selama EUR/USD berada di bawah 1,1370. Dalam jangka pendek, nilai ini mungkin mencapai EMA 200 yang terletak di 1,08
Pada awal sesi Amerika, emas diperdagangkan sekitar 3.381, mundur setelah mencapai titik tertinggi sekitar 3.397. Emas sebagai aset safe haven merasa gelisah karena ketegangan geopolitik di seluruh dunia. Dari sisi
Pada hari Senin, pasangan EUR/USD membuat pembalikan baru yang menguntungkan dolar AS, tetapi kali ini penurunannya bahkan lebih lemah. Selama sebagian besar minggu lalu, penjual melancarkan serangan yang lesu, karena
Pada grafik per jam, pasangan GBP/USD terus bergerak mendatar pada hari Senin. Pergerakan mendatar ini dimulai minggu lalu ketika serangkaian laporan penting dirilis di AS, dan perdagangan aktif diharapkan dari
Dengan pergerakan harga yang membentuk Higher Low - Lower Low serta didukung oleh kemiringan WMA (30 Shift 2) yang menurun serta pergerakan harga Minyak Mentah yang bergerak dibawahnya, maka jelas
Pada chart 4 jamnya, pasangan mata uang silang GBP/AUD nampak terlihat masih didominasi oleh para Sellers dimana hal ini terkonfirmasi oleh pergerakan harganya yang bergerak dibawah WMA (30 Shift 2)
Pada awal sesi Amerika, pasangan EUR/USD diperdagangkan di sekitar 1,1345, mencapai puncak channel tren menurun dan menunjukkan tanda-tanda kelelahan. Euro dapat melanjutkan siklus bearish-nya jika berkonsolidasi di bawah 1,1370 dalam
Your IP address shows that you are currently located in the USA. If you are a resident of the United States, you are prohibited from using the services of InstaFintech Group including online trading, online transfers, deposit/withdrawal of funds, etc.
If you think you are seeing this message by mistake and your location is not the US, kindly proceed to the website. Otherwise, you must leave the website in order to comply with government restrictions.
Why does your IP address show your location as the USA?
Please confirm whether you are a US resident or not by clicking the relevant button below. If you choose the wrong option, being a US resident, you will not be able to open an account with InstaTrade anyway.
We are sorry for any inconvenience caused by this message.


