Lihat juga


 25.07.2022 06:35 PM
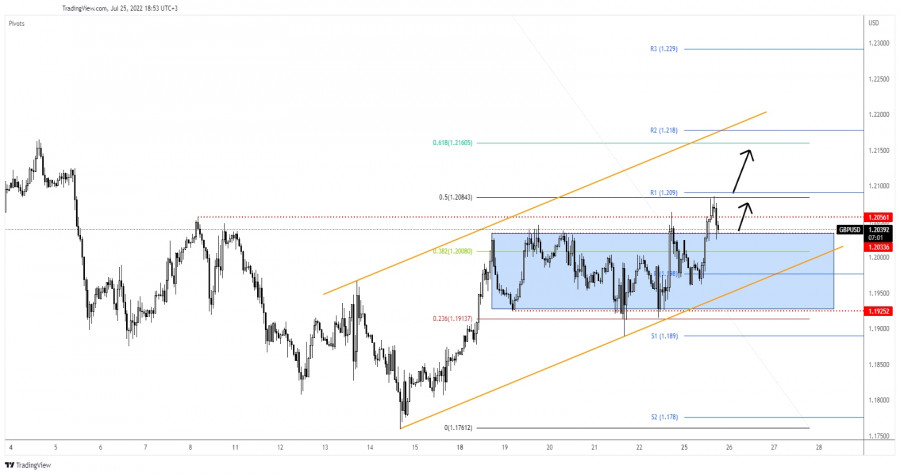
The GBP/USD pair climbed as much as 1.2085 today where it has found resistance. Now, it is trading lower at 1.2037 at the time of writing. In the short term, the rate could test and retest the broken levels before jumping higher.
Fundamentally, the CBI Industrial Order Expectations came in at 8 points below the 13 points forecasted. The GBP rallied today as the UK economic data came in better than expected on Friday. Tomorrow, the UK is to release the CBI Realized Sales which is expected at -10 points.
On the other hand, the US CB Consumer Confidence is expected at 96.8 points in July versus 98.7 points in June. The HPI, S&P/CS Composite-20 HPI, Richmond Manufacturing PMI, and the New Home Sales indicators will be released as well.
As you can see on the H4 chart, the rate found resistance at the 50% (1.2084) retracement level and now it retests the 1.2033 level. As long as it stays above this level, the rate could resume its leg higher.
The 1.2056 represented an upside obstacle. Unfortunately, the rate failed to stay above it signaling exhausted buyers. Technically, the price action signaled that the downside movement ended and that the GBP/USD pair could develop an upside reversal also because the Dollar Index is in a corrective phase.
Testing and retesting the 1.2033 level, registering only false breakdowns may announce a bullish momentum.
A new higher high, making a valid breakout above 50% (1.2090) could activate an upside continuation and could bring new long opportunities. The channel's upside line is seen as a potential upside target.
You have already liked this post today
*Analisis pasar yang diposting disini dimaksudkan untuk meningkatkan pengetahuan Anda namun tidak untuk memberi instruksi trading.
Dengan kondisi Stochastic Oscillator yang tengah menuju ke level Oversold (20) pada chart 4 jam dari pasangan mata uang silang AUD/JPY, maka dalam waktu dekat ini AUD/JPY berpotensi untuk melemah
Pada chart 4 jamnya, pasangan mata uang komoditi USD/CAD nampak terlihat bergerak dibawah EMA (100) serta munculnya pola Bearish 123 serta posisi indikator Stochastic Oscillator yang sudah berada diatas level
Pada awal sesi Amerika, emas diperdagangkan sekitar 3.220, menunjukkan tanda-tanda kelelahan. Koreksi teknis lebih lanjut menuju 21SMA kemungkinan akan terjadi dalam beberapa jam ke depan. Pada grafik H4, kita dapat
Dengan munculnya Divergence antara pergerakan harga pasangan mata uang silang EUR/JPY dengan indikator Stochastic Oscillator juga diikuti oleh hadirnya pola Bullish 123 yang diikuti oleh Bullish Ross Hook (RH)
Pada chart 4 jamnya, pasangan mata uang silang GBP/AUD nampak terlihat bergerak dibawah EMA (21)-nya dan indikator Stochastic Oscillator dalam kondisi Crossing SELL, maka dalam waktu dekat berdasarkan kedua info
Your IP address shows that you are currently located in the USA. If you are a resident of the United States, you are prohibited from using the services of InstaFintech Group including online trading, online transfers, deposit/withdrawal of funds, etc.
If you think you are seeing this message by mistake and your location is not the US, kindly proceed to the website. Otherwise, you must leave the website in order to comply with government restrictions.
Why does your IP address show your location as the USA?
Please confirm whether you are a US resident or not by clicking the relevant button below. If you choose the wrong option, being a US resident, you will not be able to open an account with InstaTrade anyway.
We are sorry for any inconvenience caused by this message.

